Diversity has become an imperative in large companies. The executive committee is a reflection of these promises of equity. In a series of articles, we reveal the situation in different countries. We start today with the United States. In this first analysis, we reveal the situation of the 50 largest American companies in terms of gender mix and ethnic representation. This analysis can be compared with the one we dedicated to female entrepreneurship. You will also find an unpublished infographic that you can reuse.
Contact the research consultancy IntoTheMinds
Statistics on the executive committees of the 50 largest American companies
- 76.1% of executive committee members are white (Caucasian)
- 70.8% of executive committee members are male
- 54.2% of executive committee members are white men
- 21.9% of executive committee members are white women
- 82% of CEOs are men
- 78% of CEOs are white (Caucasian)
- 84% of CFOs are male, and 92% are white
- 81.4% of H.R. managers are women
- Arabs are the least represented on the management committees of the 50 largest U.S. companies (1.3% men and 0% women)
- The CTO position has the highest proportion of non-whites (36.8%)
- Only one company (Berkshire) has only men on its executive committee
- Only 2 companies meet or exceed gender parity: Amerisource Bergen and Fannie Mae
- 5 companies have only white people in their executive committee (Amazon, Amerisource Bergen, Dell, Exxon, Marathon)
- Amerisource is the company where there are proportionally the most women (4 women for 3 men, i.e., 57.1%)
Summary
- Methodology
- U.S. executive committees vary widely in size
- Gender Balance in U.S. Management Committees
- Ethnic Representation on U.S. Executive Committees
- Gender and Ethnic Representation in the Most Important Functions
- Conclusions

Methodology
In this first research, we analyzed the situation of the 50 largest American companies regarding capitalization. We then researched, one by one, the management committees (called “executive committees” in the United States) from the perspective of:
- gender
- ethnicity
We coded:
- all the members of the executive committee
- 4 specific functions: CEO, CFO, HRD, CTO/CDO
Each coding was double-checked. When the ethnicity was unclear, we looked for online information about the person to objectify our decision. When the CTO/CDO function was not clearly indicated, we checked the job descriptions to identify if someone had the technological aspects under their responsibility. In most cases, this was the CIO (Chief Information Officer).
We then innovatively visualized the data (see below). A high-resolution version is available here.
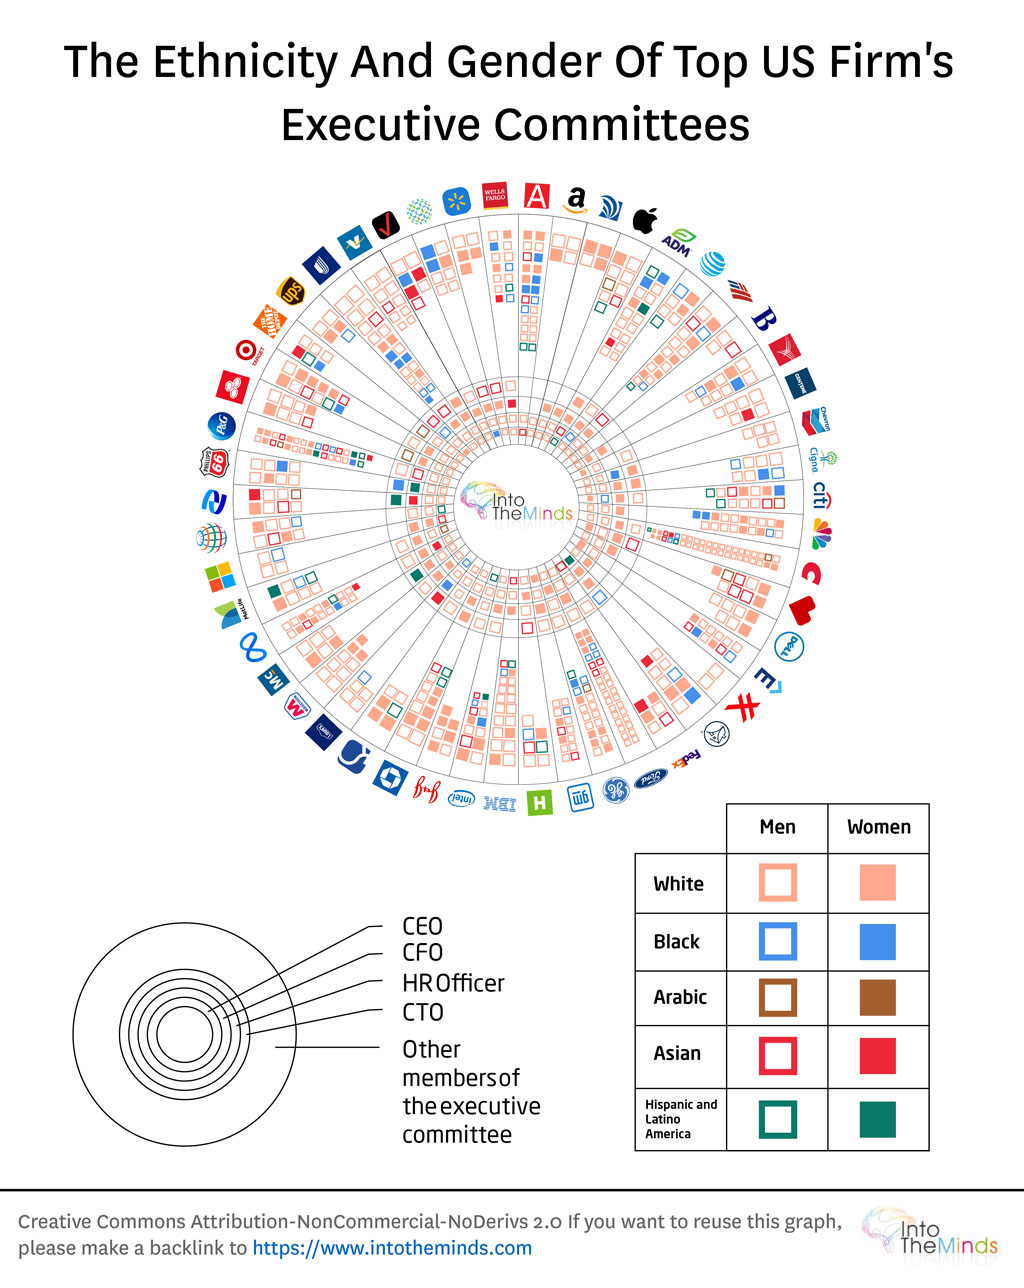
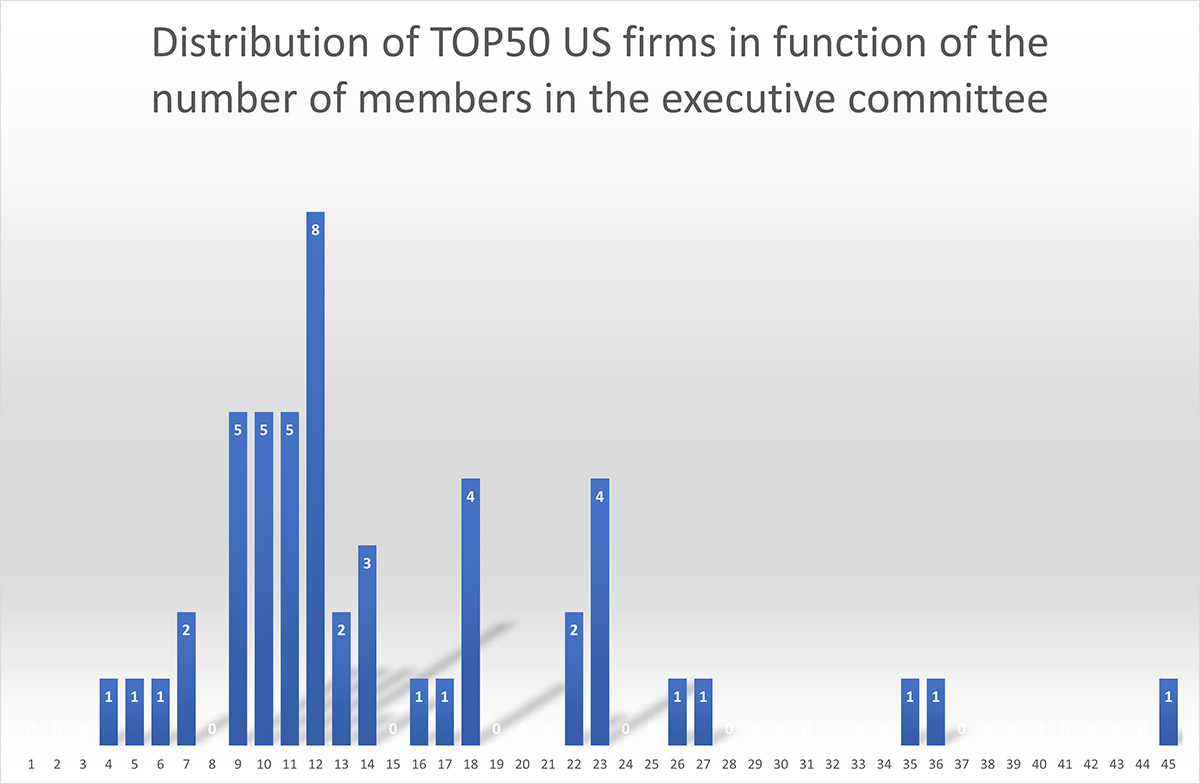
The size of executive committees in the United States: a universe of disparities!
The first lesson of this research is that the size of the executive committees of large American companies varies greatly. They range from 5 people at Berkshire to 45 people at Costco. The average is 15 members.
The very large management committees. As you can see from the chart below, the norm is around 10 members, with the most represented size being 12. This is, for example, the case at Apple or Pfizer.
Gender balance on U.S. executive committees
The first metric we looked at was gender diversity. This is a very important subject, the realities of which vary from country to country … and from legislation to legislation. While the European Commission only legislated in October 2022 on the subject, some countries are much further ahead than others (see table below).
| Country | Year of the introduction of the law on gender diversity in management bodies | Target percentage |
| Germany | 2015 | 30% |
| Austria | 2017 | 30% |
| Belgium | 2011 | 33,33% |
| Spain | 2007 | 40% |
| France | 2011 | 40% |
| Greece | 2020 | 25% |
| Italy | 2011 | 40% |
| The Netherlands | 2011 | 30% |
| Portugal | 2017 | 33,33% |
What about the United States?
We find that of the 753 members of the 50 executive committees researched:
- 29.2% are women (220)
- 70.8% are men (533)
Therefore, the percentage of women on American management committees is close to 30%, which is the objective in several European countries.
Seven companies meet or exceed the most ambitious target of 40%. Only two companies reach parity:
- Fanny Mae: 50%
- Amerisource Bergen: 57%.
We observe that the proportion of women also varies according to the sector of activity. Some sectors seem more conservative than others. However, the results should be taken cautiously since the number of companies in some sectors is sometimes very small. In the companies of the automotive sector of the TOP50, for example (Ford and General Motors), the proportion of women reaches only 18.5%. On the other hand, in the pharmaceutical industry, 42.9% of the companies in the ranking (AmerisourceBergen, Walgreens Boots Alliance, Johnson & Johnson, Pfizer) have women on their management committees.
Here are the averages for the other sectors:
- Retail (7 companies): 26.3
- Technology (6 companies): 29.9
- Oil (5 companies): 26.9
- Healthcare (8 companies): 29.7
The oil industry appears to be the most conservative, with only 9.6% non-Caucasian (non-white) representation.
Ethnic Representation on U.S. Executive Boards
For this section, we analyzed the ethnicity of the 753 members and classified them into one of the following categories:
- Caucasian (white)
- Black
- Asian
- Arab
- Hispanic
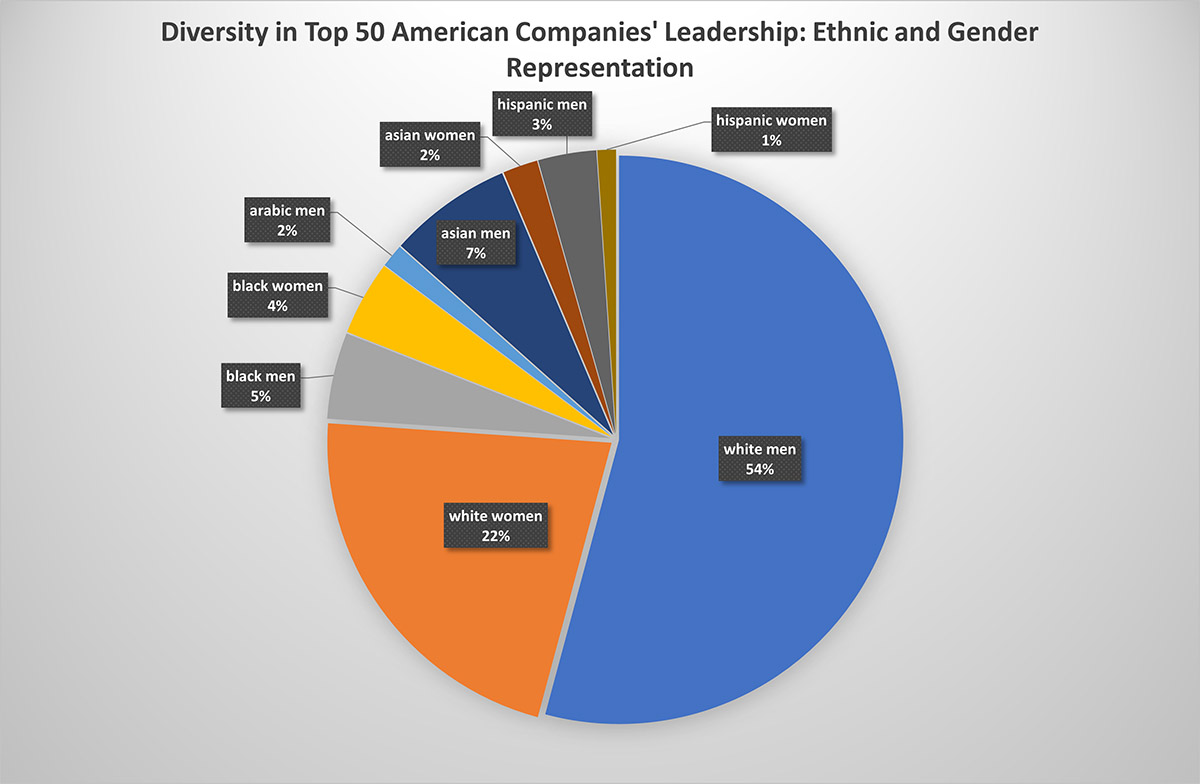
Not surprisingly, Caucasian men and women are the most represented. Caucasian men comprise 54% of executive committee members, and Caucasian women 22%. Non-Caucasians thus make up less than a quarter of U.S. executive committee members. Of these, the black minority holds a little less than 10% of the seats, followed by Asians (9%), Hispanics (4%), and Arabs (2%).
Some companies stand out for their ethnic minority representation:
- Lowe’s: 44,4%
- Alphabet: 42,3%
- Pfizer: 41,7%
- Citigroup: 41,2%
- The Home Depot: 40%
- Procter & Gamble: 40%
Others, on the other hand, do not have ethnic minority representatives on their management committees. These include:
- Amazon
- Exxon Mobil
- AmerisourceBergen
- Marathon Petroleum
- Dell Technologies
The analysis by sector of activity sheds light on the possible conservatism of certain activities. As before, we only provide figures for sectors with at least two representatives.
The petroleum industry appears to be the most conservative, with only 9.6% non-Caucasian (non-white) representation. Conversely, in transportation (UPS, FedEx), 1/3 of the board members are non-Caucasian (non-white).
Here are the averages of non-Caucasian members for the other sectors:
- Retail (7 companies): 22.2%
- Technology (6 companies): 26.2%
- Pharma (4 companies): 23.8%
- Healthcare (8 companies): 25.2%
Gender and ethnic representation within the most important functions
We arbitrarily researched 4 specific functions within the executive committees:
- CEO
- CFO
- HR manager
- CTO/CDO
For each of them, we provide an analysis by gender and ethnicity.
Representation of women in the most important functions
The first observation is that 2 functions resist women: CEO and CFO. The CFO position is even more closed to women than the CEO position. Indeed, 18% of CEOs are women, and only 16% of CFOs.
Some clichés are hard to break. This is the exact opposite of the position of HR Director. We find 81.4% of women in this position.
The CTO/CDO position, with its strong technical connotation, offers a more pronounced gender mix. Technical skills undoubtedly take precedence over gender, which explains why the percentage of women in this position is 23.7%.
| CEO | CFO | MHR | CTO/CDO | |
| Men | 82,0% | 84,0% | 18,6% | 76,3% |
| Women | 18,0% | 16,0% | 81,4% | 23,7% |
Ethnic representation in the most important functions
Ethnic representation in the most important functions
Regarding ethnicity, the results are unsurprising for the most important functions of executive committees. CEOs are 78% white, and CFOs are 92% white. CTOs/CDOs have the most ethnic diversity, with 36.8% of the people we analyzed being non-Caucasian. 21% of CTOs/CDOs are of Asian origin, which is symptomatic of the preponderance of this continent (China, India) in the digital and technological sphere.
| CEO | CFO | MHR | CTO/CDO | |
| Caucasian (white) | 78,0% | 92,0% | 83,7% | 63,2% |
| Non-Caucasian (non-white) | 22,0% | 8,0% | 16,3% | 36,8% |
Conclusions
The analysis of the executive committees of the 50 largest U.S. companies provides an interesting analysis of ethnic and gender representation.
These 50 largest companies are headed by a little less than 30% of women, which brings them close to the most ambitious objectives in force in Europe.
In terms of ethnic representation, however, progress must be carried out since 76% of the members of the management committees are Caucasian (white). This under-representation is particularly visible in the most important functions (CEO, CFO, MHR), which are overwhelmingly white (78%, 92%, and 83.7%, respectively). The technology function (CTO/CDO) is more open to more diverse profiles, with more than a third of its representatives coming from other communities.
Finally, the analysis by sector of activity reveals a certain conservatism. The oil industry, for example, has only 9.6% non-white executives, and the automobile industry is only 18.5% women.
Posted in Research.