How does Linkedin algorithm influence? What is the correlation between the number of likes or comments and the number of views in LinkedIn?
Everybody’s trying to understand LinkedIn’s algorithm. Some are even trying to hack it.
While theories abound, no one knows how it works. I’ve rolled up my sleeves, and today I’m going to explain it to you, with a statistical model to back it up.
BONUS: receive your personal statistical analysis
I suggest you perform the same analysis for your LinkedIn activities. Subscribe to the newsletter below, and you will receive an email with instructions on how I can help you. I may also organise a webinar to show you the method. If you want to be informed, subscribe to the newsletter here too (don’t forget to validate the confirmation email you will receive after entering your address).
If you only have 30 seconds
- I have put together “by hand” a dataset of all my LinkedIn publications for the last 17 months.
- metadata have been generated for each publication (presence of a hyperlink, photos, …)
- as a first approximation, I did not take into account other variables (presence of a hyperlink for example)
- The analysis is specific to each one and depends on the size and composition of your network.
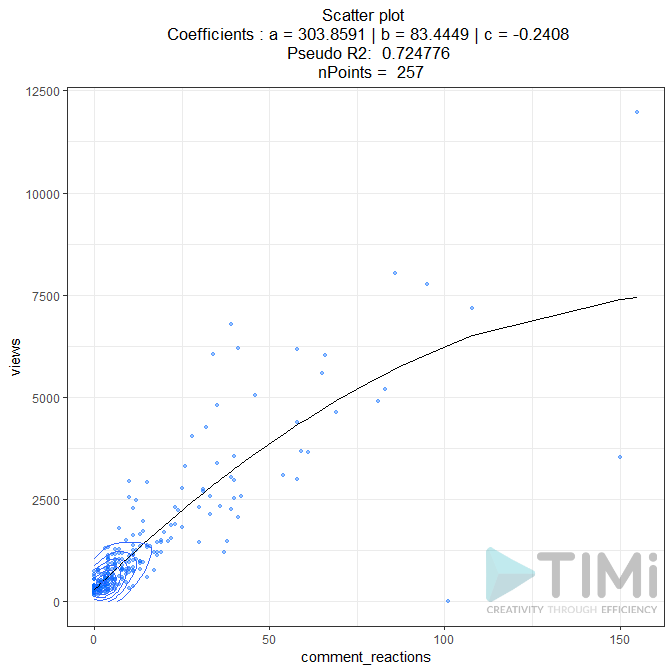
- A statistical analysis conducted with Anatella and Tableau shows that each reaction/comment yields 83 views on LinkedIn
- When you don’t collect any likes or comments, your LinkedIn post stagnates at about 300 views.
- If you want to know how the algorithm works on YOUR network, send me an email (or a request for a LinkedIn connection 🙂 so that I can help you.
Summary

Introduction

The LinkedIn algorithm remains somewhat of a mystery. A common hypothesis is that the number of reactions (like, curiosity, see opposite) attributed in the first 2 hours of publication is crucial to make the publication go viral. However, since the update of the Linkedin algorithm, this hypothesis may be questionable.
The hypotheses, therefore, remain general and no studies have been made on the propagating effect of reactions and comments. In other words, how many more people are likely to be affected when someone reacts or comments on your LinkedIn post?
I will reveal all in today’s article.
Focus on Anatella
Anatella is one of my favourite “data” tools (if you want more information or a demo, send me a mail) and it’s free for small businesses. It is an ETL (Extract – Transform -Load) solution that allows you to manipulate large amounts of data easily for analysis. Thanks to a superb integration with R, it is also straightforward to perform statistical analysis without having to code in R. That’s good for me because even though I’ve learned to develop in R, lack of practice makes you forget everything very quickly.
 Methodology
To build the dataset, I went back as far as I could in my posts to note :
- the number of views
- the variables characterising the post (presence of a hyperlink, a photo, a video, the text of the post, hashtags, …)
I managed to obtain 17 months of retrospective analysis.
The final dataset consists of 257 posts, spread over 17 months, coded according to 17 variables. In the end, we have a small dataset containing 4369 posts. It’s small, but the effort (manual) to build this dataset is quite important (about 10 hours of work).
For the analysis, I used Anatella for data preparation, Tableau Software for data visualisation, and R for statistical analysis (via integration in Anatella).
The preparation of the data is done thanks to a simple flow (see above) in which I cleaned the data, eliminated empty fields, and created a variable “comment_reactions” which is the sum of the number of reactions and the number of comments.
Different types of basic models have been tested to simulate the number of views (dependent variable). A polynomial model gave the best results.
Results
Here’s the part for which you’ve all been waiting. What is the relationship between the number of reactions/comments and the number of views?
The graph below shows you the result of the modelling. You can see that even without likes and comments, a publication should still reach 303 people. Each like or comment brings an increment of 83 additional views. Beyond 100 likes+comments, the model marks an inflexion which is mainly due to the absence of measurement points (only 2).

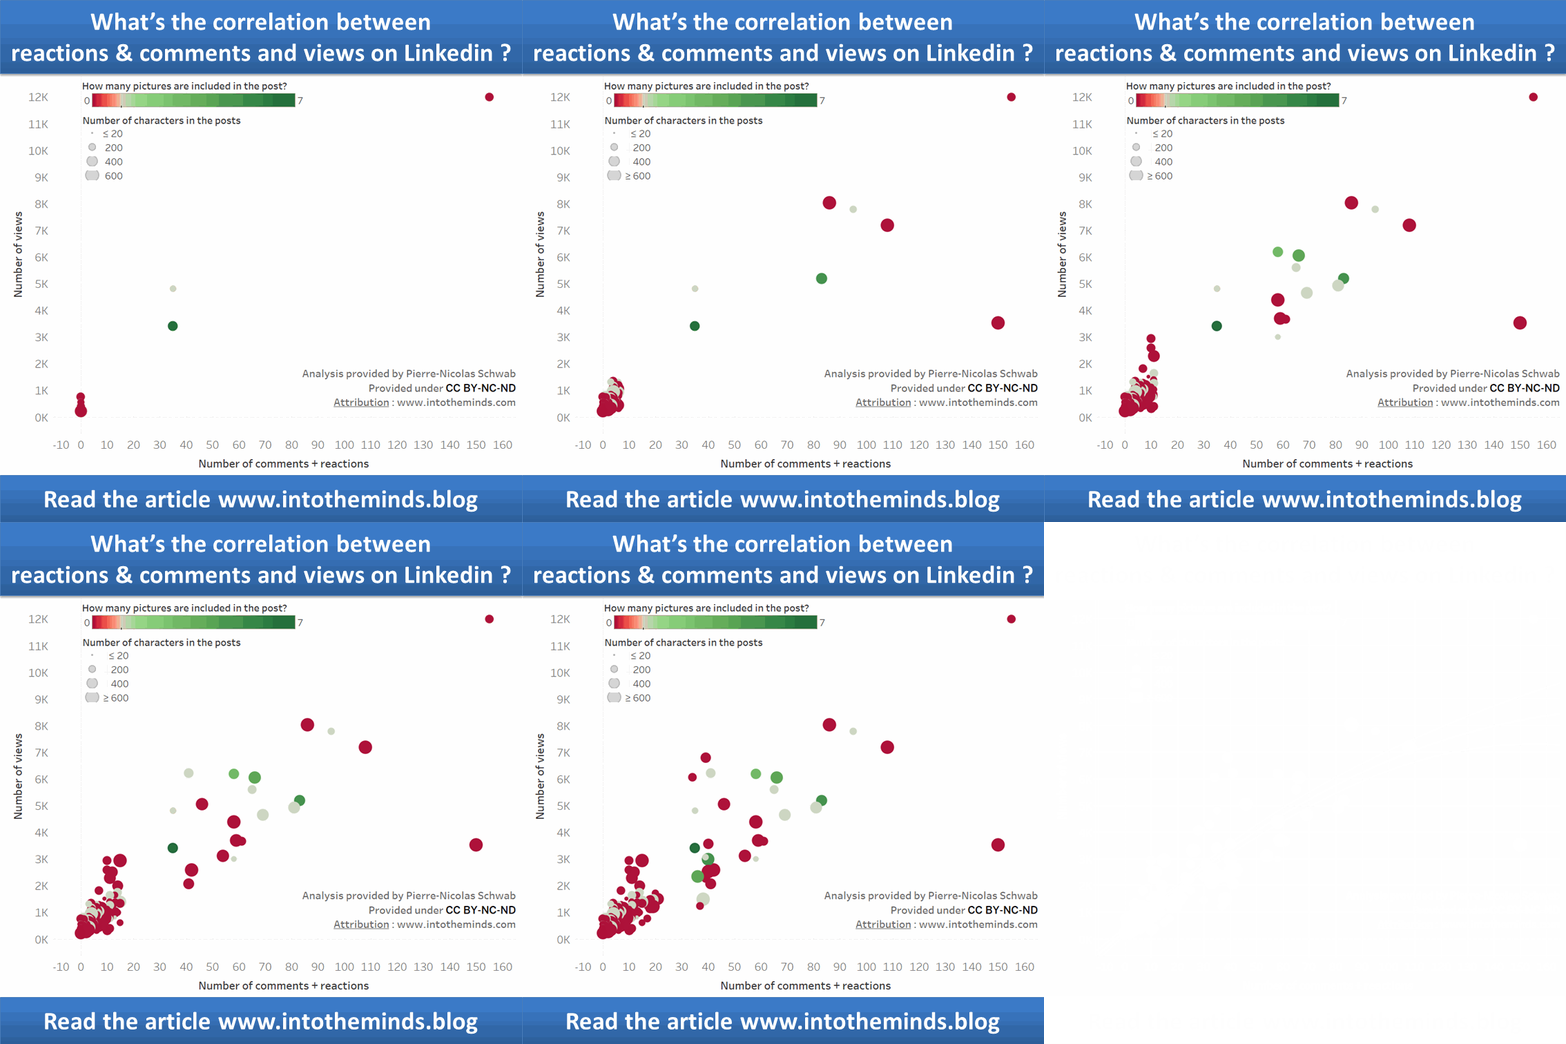
The trend line in Tableau gives roughly the same result (Tableau shows an R² of 0.78; Anatella a pseudo-R² of 0.72). I have added some additional dimensions in the table view: presence of photo in the post: red when there are no photos, green when the number of photos is >1.
The size of the measuring points represents the number of characters in the LinkedIn post. The larger the “bubble”, the longer was the LinkedIn post.
Limitations
Network effects are not taken into consideration in this study. The date and time of publication are also not taken into account because the “timestamp” of the publications is not available.
There are few measurement points for large view values. It is, therefore, necessary to increase the size of the dataset with very popular (viral) publications to remodel the set.
The analysis only concerns one person (me), which is, of course, the most critical limitation. If you wish to contribute to this research effort, contact me, and I will do the statistical analysis.

Posted in big data.


21 June 2020
This is great research, love it. Will get in contact with you to share some data of my posts. I do a lot of business for my website MrWheelson by using LinkedIn, so this information is great for me!
21 June 2020
Thank you for your intrerest in my research. I’m looking forward to working with you on advancing knowledge on the Linkedin algorithm.