Understanding how LinkedIn’s algorithm works is a necessity to stay visible on this social network. This article reveals the results of an analysis I realized using 4.599 million LinkedIn posts in 193 countries. The results are surprising and challenge a lot of preconceived ideas. Only 3 factors play a role in the visibility of LinkedIn posts. This article also includes the research results I have already published on the effect of hashtags, the influence of the word count, and the impact of emojis on the popularity of your LinkedIn posts.
If you’re interested in my analyses, consider subscribing to my newsletter below (make sure to confirm the confirmation link sent to you) and send me a request to connect on … LinkedIn ? You may also want to download the free full 36-page report in pdf format.
Summary
- Introduction
- Results in a nutshell
- Detailed results
- Factors that don’t influence: language, country and … hashtags
- Factor of influence n°1: the size of the network
- Factor of influence n°2: the number of words
- Factor of influence n°3: the number of emojis
- Methodology
- Conclusions and acknowledgements
- Download the full report

crédits : Shutterstock
Introduction
Understanding how algorithms work is a challenge for anyone active on the networks. Algorithms determine the visibility of your contributions to the entire network. LinkedIn is no exception. “Dwell Time” is the principle that governs visibility on this professional network. But how to “hack” the algorithm without resorting to forbidden methods (buying likes, pods)?
To answer this question, I used a dataset of 4.599 million LinkedIn posts provided by Linkalyze. I prepared it using the data science solutions proposed by TIMi: Anatella for data preparation, Modeler for statistical modeling. I invite you to read the part of this article dedicated to the methodology. You will find all the technical details and the technical recipe allowing you to prepare the data with Anatella and “make them talk” with Modeler.
Results in a nutshell
- Only 3 factors have a statistically significant influence on the visibility of LinkedIn posts: the number of people in your network, the number of words, the number of emojis.
- Variables such as hashtags, post language, or country do not significantly influence the visibility of LinkedIn posts.
- The size of your network explains 34% of the visibility of your LinkedIn posts.
- The number of words used in your LinkedIn posts explains 19.1% of their visibility
- Emojis account for only 2.4% of the probability of getting 100 or more reactions.
- 51.04% of LinkedIn users have less than 1442 connections, only 7% have more than 10000 and 1.3% more than 20000.
- 80.3% of posts on LinkedIn are less than 92 words.
- 2.2% of LinkedIn posts are over 200 words.
- 80.12% of posts on LinkedIn do not contain emojis.
Detailed results: the 3 factors that influence the visibility of your LinkedIn posts
First of all, it is essential to define the term “visibility” on LinkedIn. In this analysis, I explored the probability of getting 100 reactions (Likes and comments combined) for members with 25,000 connections at most. I, therefore, made 2 arbitrary choices which can be explained by:
- my desire to define a binary objective (100 reactions) which is probable but rare;
- the need to eliminate accounts that bias the results (personalities followed by hundreds of thousands or even millions of people)
Methodological note: variables taken into account in the model
In a previous analysis, I studied the role of hashtags. In this preliminary analysis, I did not include emojis. However, it appears that the impact of emojis, although modest, surpasses that of hashtags to the point of making the latter insignificant.
This type of phenomenon is quite common and appears when new variables are considered in a prediction model.
The results are, therefore, likely to change as new variables are included in the model. Currently, the prediction model takes into account the following variables:
- size of the network
- number of hashtags
- number of emojis
- number of words
- language
- country
In the end, only 3 factors play a role in the number of reactions (and therefore on the visibility) of your LinkedIn posts:
- 34% of the effect is explained by the size of the network
- 19.1% by the number of words
- 2,4% by emojis
These 3 factors explain 55% of the visibility. The factors that make up the remaining 45% are not known.
Factors that have no influence: language, country and … hashtags
Country and language do not influence your likelihood of getting 100 reactions on a LinkedIn post. This is good news because you don’t have to live in the United States or write in English to achieve this feat.
However, the surprise that appears when all variables are taken into account in the same model is that hashtags have no statistical influence. In other words, hashtags do not significantly influence the probability of getting 100 reactions. In the first model I blogged about, emojis had not yet been considered, “leaving room” for hashtags to exert their effect. But as soon as emojis were included in the model, their impact, although modest (2.4% of the total), “crushed” that of hashtags.
Factor #1: the size of your network influences the visibility of your LinkedIn posts
The analysis of these 4.599 million LinkedIn posts clearly shows the effect of network size. It is ultimately very logical: the more extensive the network of a LinkedIn member, the higher the probability of harvesting on one of these posts.
What is surprising, however, is to see the influence of this variable: 34%. In other words, reaching 100 reactions on LinkedIn is conditioned for 1/3 by the size of the network. To put it simply, the probability of getting 100 reactions increases by 1% for every 500 connections.
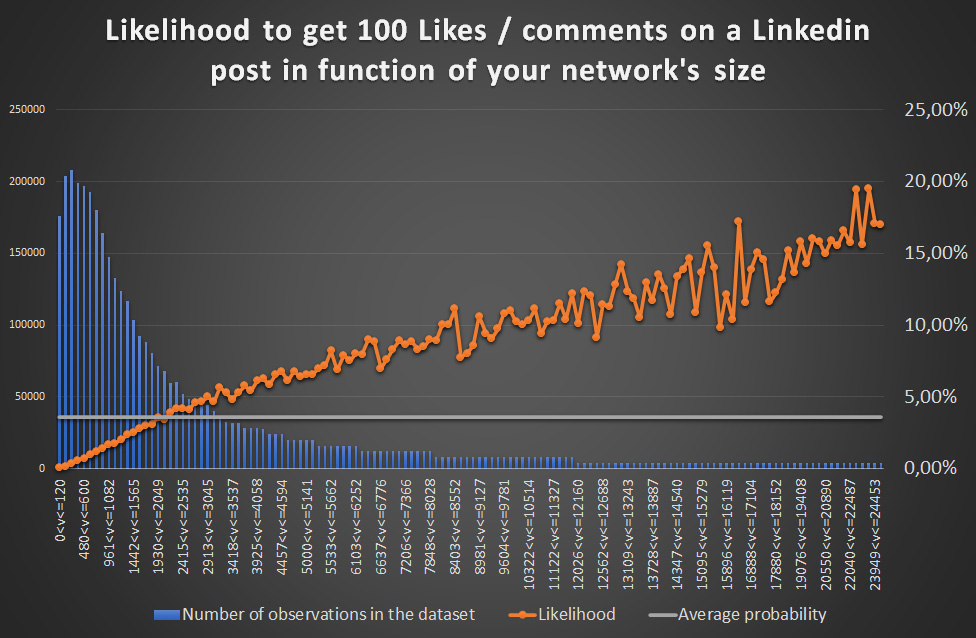
50% of LinkedIn users have less than 1442 connections. With 1442 connections, you have a 1 in 50 chance of getting 100 likes/comments (2%).
However, when you have 24,000 connections, the probability rises to 19%. That’s almost 10x more.
Conclusion #1: If you want to be visible on LinkedIn, make sure you have an extensive network. That’s the #1 key to success. Unfortunately, LinkedIn just limited the number of invitations you can send each week to 100. So, you’re going to have to develop alternative strategies, as I explained in this article.
Factor #2: the word count accounts for 19.1% of the virality of LinkedIn posts
The second major factor is the word count of the LinkedIn post. It accounts for almost 20% of the probability of reaching 100 likes or comments.
A post containing 220-230 words is 6x more likely to get 100 likes/comments than the average.
As I explained in detail in this article, the effect is not linear. An inflection point is visible around 150-170 words. This means that there is a definite interest in exceeding this limit when writing content.
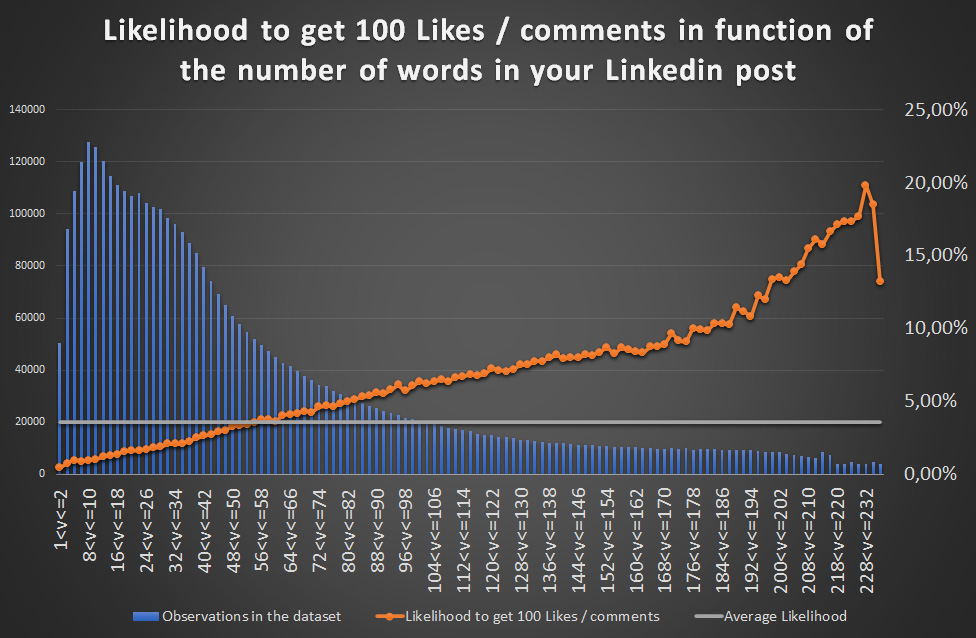
This effect is explained by the changes made to the LinkedIn algorithm in 2020. The “dwell time” becomes the variable that conditions the visibility of a post within the LinkedIn network and, therefore, its ability to be liked or commented. “Dwell time” measures the time spent interacting with content. The more time a user spends on content, the more the algorithm infers that this content is interesting and deserves to be exposed to other people in the network. A 224-word piece of content is more likely to engage the user for a more extended period than a 50-word piece of content. So, the effect was predictable but is quantified for the first time.
As for the visible inflection point around 150-170 words, I can’t explain what it can represent.
Conclusion #2: if you want to attract likes and comments on LinkedIn, it’s better to write lengthy posts, in any case above 176 words.
Factor #3: the number of emojis influences the success of your LinkedIn posts
The last variable with a significant effect is the number of emojis. I have discussed it in detail here.
We see a positive effect from the 1st emoji. In other words, putting a single emoji in a LinkedIn post already increases your chances of getting 100 likes/comments.
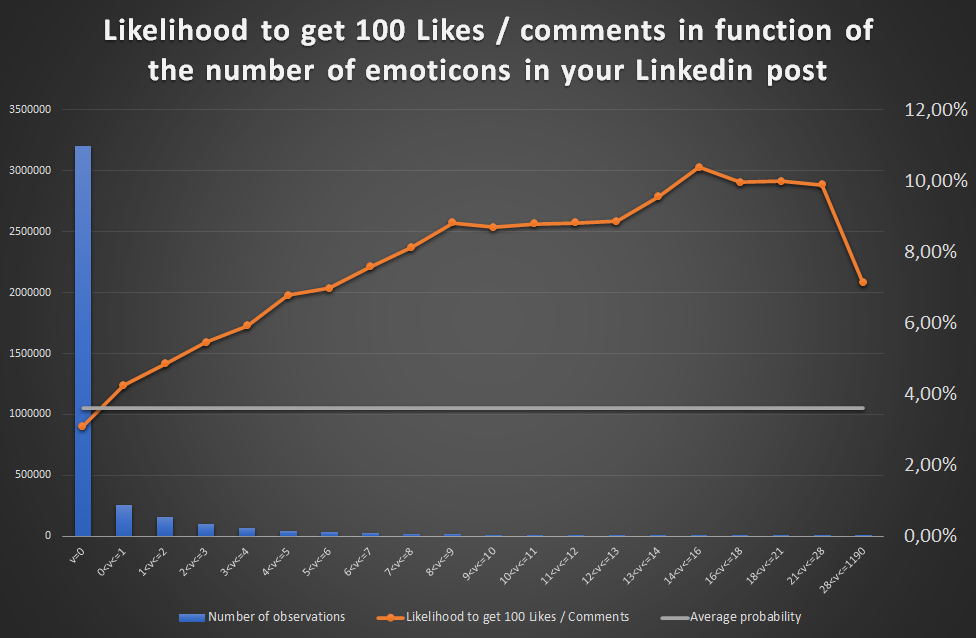
The reason is quite simple to understand when you see the statistical distribution of LinkedIn posts in emojis. 80% of the posts do not contain a single one. Including 16 emojis,
as seen in the graph below, is optimum. With 16 emojis, your chances to exceed 100 reactions are multiplied by 2.5.
The analysis does not say where these emojis should be included or which emojis they should be.
Conclusion n°3: put emojis in your LinkedIn posts, and preferably put a lot of them. My intuition tells me that visible emojis on the first 3 lines of the post are decisive, but I still have to prove it.
Detailed methodology
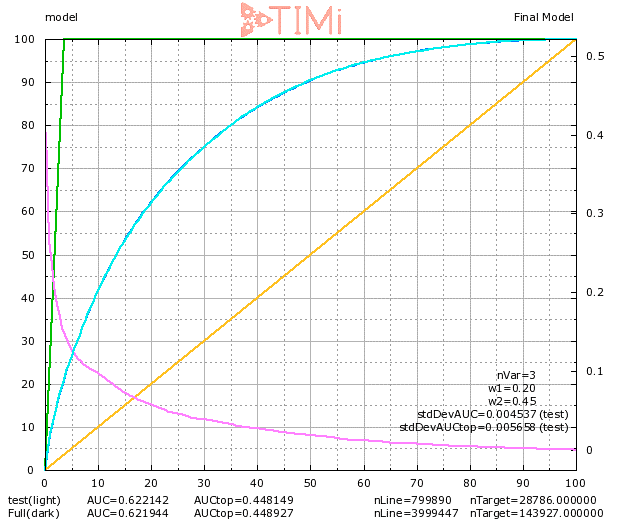
I used TIMi Modeler to find the best-performing prediction model.
Specifically, I considered 6 independent variables:
- the name of subscribers to the person who posted the message
- the country entered in the author’s profile
- the language in which the post was written
- the number of words
- the number of emojis
- the number of hashtags
To avoid introducing bias, LinkedIn members with a network of more than 25,000 subscribers have been eliminated from the dataset. VIPs have no trouble getting 100 likes, unlike mere mortals like you and me.
I modeled the predicted variable in binary form. Rather than predicting the number of likes or comments, I sought to predict the probability of exceeding 100 reactions (likes + comments).
I chose this 100-reaction limit arbitrarily because less than 3% of posts on LinkedIn reached this threshold. I, until recently, had only reached it once.
I tested several types of modeling (CART, random forest), but in the end, it was the “in-house” algorithm of TIMi Modeler that gave the best results. The AUC (Area Under the Curve) is 62% with 3 variables. This means that 3 variables out of the 6 have a significant “contribution” in predicting the outcome.
crédits : Shutterstock
General conclusion
These initial results provide an objective overview of the influence of various factors on the visibility of LinkedIn posts. These results call into question the hypotheses developed on the supposed effects of this or that practice.
Nevertheless, it is essential to keep in mind that;
- only 6 variables were taken into account, and that other effects remain to be investigated
- the causal link between these factors (emojis, word count) and the number of reactions is still unknown. At this stage, it is impossible to say if it is the algorithm that pushes posts containing emojis or if emojis attract the attention of users who click on them more and send a positive signal to the algorithm.
So, there is still a long way to go before we understand all the finer points of Linkedin’s algorithm (if it is possible to understand it at all).
Acknowledgments
At the end of this first analysis, I would like to thank Sylvain Tillon, Thomas Pons, and Laetitia Verrière from Linkalyze, who provided me with the dataset.
My warmest thanks also go to Frank Vanden Berghen for providing the TIMi suite used in this work.
Full-report for download
virality-success-factors-linkedin-postsPosted in big data.
31 May 2021
This is welcome, detailed and valuable research, Pierre-Nicolas. Thanks you for tyour work in creating this, and your generosity in making it freely available.
31 May 2021
thank you for your kind words. Knowledge is worth nothing if it’s not shared with others.
If you can, be kind enough to make a link from your website to this study. It will help make it better known.
Thank you