
Energy-efficient software: a source of competitiveness
Energy efficiency is a concept that also applies to IT. In this article, I develop the idea that choosing a software solution based on its programming language can bring productivity and financial gains.
![Data marketing: advantages, strategy, and examples [Guide 2023]](https://www.intotheminds.fr/blog/app/uploads/data-marketing-computer-240x240.jpg)
Data marketing: advantages, strategy, and examples [Guide 2023]
Data marketing is a discipline that is becoming more and more important in companies. It provides a better understanding of the real motivations of users, but also of their consumption patterns. The data analysis it offers improves marketing strategies and creates competitive advantages. To better understand the challenges of this process, we will review its main advantages and present useful strategic advice. Finally, we will see how Google and Adobe develop comprehensive data marketing solutions. Contact...

ETL: Anatella in web version with high performance
If you are interested in data science, you know that data preparation is a very time-consuming step. That’s why choosing the right ETL software is so important. My favorite solution is called Anatella. I appreciate its qualities in terms of speed and the richness of the proposed transformations. So, of course, I am always enthusiastic when a new product arrives on the market. In this case, it is the web version of Anatella which allows the publisher Timi to propose a very disruptive price. Anatella...
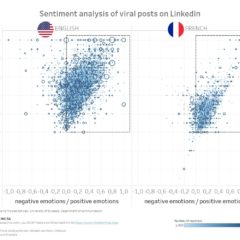
LinkedIn: the sentiments expressed and their effect on virality
Everyone agrees that the content of LinkedIn posts is a determining factor in the probability that they go viral. So today, I’m not going to answer the question “What should we talk about on LinkedIn?” but rather “How should we talk about it?” I used a corpus of 4 million LinkedIn posts to measure the sentiments expressed and analyze the correlation with their virality. This analysis follows the one I published here on a set of 4.6 million posts and in...

The 11 challenges of data preparation and data wrangling
The events of 2020 have accelerated the shift to telecommuting and digital relationships. With digitalization, another transformation is also underway: the analytics transformation. To face this data revolution, I find that businesses do not necessarily have the right tools for preparing and analyzing data (data preparation or data wrangling). In this article, I wanted to put into perspective the role of these tools in the functioning of the business. In particular, I think they can contribute to efficiency...

Data preparation: how to reduce the processing time by 85%
In a previous article, I realized using a benchmark of 4 ETL solutions to process a file of one billion lines. Today I test the effect of SSD and proprietary file formats on processing speed in Alteryx, Tableau Prep, Talend, and Anatella. The results are quite unexpected. Introduction and review In my previous analysis, I compared the processing speed of 4 data preparation solutions: Alteryx, Talend, Tableau Prep, and Anatella. After its publication on social networks, which raised several voices to criticize the...

The 3 factors that determine 55% of the success of your LinkedIn posts
Understanding how LinkedIn’s algorithm works is a necessity to stay visible on this social network. This article reveals the results of an analysis I realized using 4.599 million LinkedIn posts in 193 countries. The results are surprising and challenge a lot of preconceived ideas. Only 3 factors play a role in the visibility of LinkedIn posts. This article also includes the research results I have already published on the effect of hashtags, the influence of the word count, and the...
Here is the most crucial factor for the virality of your LinkedIn posts
After discussing the effect of emojis and the word count on the virality of LinkedIn posts, it’s time to reveal THE factor that crushes all others. This factor accounts for 1/3 of the success of your LinkedIn posts. So, you should take the time to read the research results I just conducted on 4.6 million LinkedIn posts in 193 countries. I obtained the unpublished results presented here thanks to data made available by Linkalyze. They were prepared and analyzed using the...
![LinkedIn: engagement statistics by country and language [2021]](https://www.intotheminds.fr/blog/app/uploads/likes-comments-share-240x240.jpg)
LinkedIn: engagement statistics by country and language [2021]
How does engagement on LinkedIn vary by language and country? Globally, 71.06% of LinkedIn posts receive no comments, and 24.39% receive no likes. The analysis of 4.599 million LinkedIn posts gives us an objective view of the essential differences that exist. The data comes from a dataset made available by Linkalyze. The data preparation was realized using Anatella (Timi) and the visualization using Tableau. If you are interested in these results, do not hesitate to subscribe to my...

LinkedIn: the surprising effect of emojis on the virality of posts
Should you put emojis in your LinkedIn posts, and if so, how many? In today’s article, I reveal the results of research I conducted on 4.599 million LinkedIn posts. This research follows the ones I’ve already published on the impact of hashtags and the word count. If you want to be the first to receive my results, subscribe to my newsletter (don’t forget to click on the confirmation link sent to you by email). Only for our subscribers: exclusive...
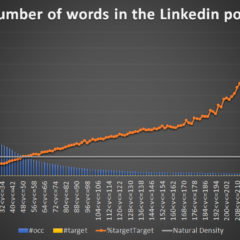
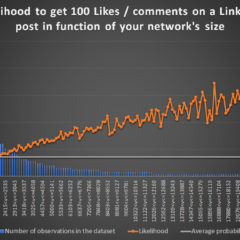
224 words, the magic number to boost the impact of your LinkedIn posts
Word count is one of the factors that determines the success of a post on LinkedIn, along with hashtags. I have made an analysis of nearly 5 million posts in 100 countries that shows a linear correlation between the word count of a post on LinkedIn and its number of likes/comments. Posts between 224 and 227 words are 6x more likely to get more than 100 reactions than the average. If you’re interested in this topic, subscribe to my...
![How many hashtags should you put in your LinkedIn posts? [Research]](https://www.intotheminds.fr/blog/app/uploads/analysis-hashtags-linkedin-240x240.jpg)
How many hashtags should you put in your LinkedIn posts? [Research]
How many hashtags should you put in your LinkedIn posts to increase their visibility? By the way, is it a good thing to put hashtags, and how does the LinkedIn algorithm react? I have analyzed 4.988 million LinkedIn posts in more than 100 countries, and I will give you the answer in this article. If you want to receive more exclusive results by email, please subscribe to my newsletter and follow me on LinkedIn. Only for our subscribers: exclusive analyses...

Data Mining: Definitions, 5 Free Tools, and Techniques
After the collection and preparation process, data analysis is necessary to find meaning in a data set. Looking at a page of data does very little for building models of customer behavior, so we need an intelligent way (data mining) to sift through information. By using statistics-based approaches and algorithms, we can start to mine data. Only for our subscribers: exclusive analyses and marketing advice Email address * Subscribe By signing up, you agree to our...

The place of data wrangling in the data value cycle
In the world of data, data wrangling is a bit of a buzzword these days. We have already proposed a general overview here. In today’s article, we explain it in more detail and position data wrangling within the data value cycle. Summary Reminder on data wrangling Step 1: data acquisition Step 2: data storage Step 3: data exploitation Only for our subscribers: exclusive analyses and marketing advice Email address * Subscribe By signing up, you agree to our...

Excel dominates the business world… and that’s not about to change
Few brands have a 100% penetration rate. Microsoft is one of them. Even better, one of its products, Microsoft Excel, is used by 99.99% of the world’s businesses. Microsoft Excel is everywhere. Can’t stand it anymore? Well, you’re going to have to get used to it because it’s not going to change any time soon. But if Excel has undeniable qualities, we must also question its efficiency in performing specific processes. And this is probably where the problem...
The UK Data Ethics Framework Explained
First published in June 2018, the Government’s Data Ethics Framework is another way of protecting our sensitive information in a data-driven world. The framework was then updated in September 2020 to be more extensive and to create more awareness of these guidelines. Yet despite this, many are still unaware of what this framework actually is and what purpose it serves. That’s why we’ve put together this guide. Below, we’re going to explain the Data Ethics Framework...
Data wrangling: definition, steps, tools [guide 2021]
Data wrangling might sound like quite the intimidating tech term on the surface yet anyone can develop an understanding of this process with a little bit of time and effort. Data wrangling, also known as data munging, is part of the larger process of “data preparation”. Data wrangling is the process performed to collect, select, re-structure, enrich and ultimately transform information with the aim of answering a specific question. This overarching question is usually highly analytical....
ETL benchmark: how long does it take to process 1 billion lines?
In a previous article, I highlighted the importance of processing speed when choosing a data preparation solution (ETL). I made a first benchmark between Alteryx, Tableau Prep, and Anatella on a file of 108 million lines. This time I repeated the operation on 1.039 billion lines and added Talend to the benchmark. The results are unexpected since the processing speeds vary by a factor of 1 to 20. TEASER : stay tuned. In my next article I’ll show you a trick...
Data preparation: how to choose the right solution for your needs?
I regularly use 4 data preparation solutions: Alteryx, Tableau Prep, Talend, and Anatella. The G2 benchmark lists no less than 40 of them. This article explains why the G2 benchmark is not necessarily relevant and what criteria to use to compare the ETL (Extract – Transform – Load) solutions best suited to your needs. Summary What is an ETL? The G2 benchmark criteria The most important criteria for choosing an ETL, in my opinion Conclusion crédits : Shutterstock Introduction: what...
Benchmark: which ETL to choose to handle large files?
When it comes to data preparation, it is clear that a large part of the processes still takes place offline, with archives extracted from relational databases. And when these archives need to be manipulated by data engineers, it is essential to have an ETL that can handle the load. In today’s article, I propose to tackle the fascinating subject of large files by comparing 2 ETL’s that I use daily: Alteryx and Anatella. Business context: when are large...
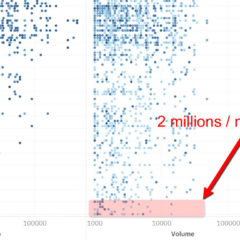
SEO: 50,000 pages analyzed and 2m of queries easily accessible
SEO research. We analyzed 50000 web pages, covering 185 keywords related to data science in 16 countries. The raw data came from Ahrefs. We used Anatella to prepare and clean the data and Tableau to visualize it. This research’s main result is that there are untapped opportunities to rank on the first page of Google on English keywords outside English-speaking countries. Here is what we learned. Some figures from our SEO research The United States is not...
![Data preparation: definition, examples, advice [guide 2023]](https://www.intotheminds.fr/blog/app/uploads/desk-research-data-graphs-figures-240x240.jpg)
Data preparation: definition, examples, advice [guide 2023]
To talk about data preparation, what better way to start than from observation. In the world of data, there is a rule that everyone knows: 80% of a data scientist’s time is spent preparing his data, and only 20% working on it, especially its visualization. This article will focus on data preparation: the most frequently encountered problems, tools, and trends. Let’s go for new data adventures! Summary Introduction Data preparation: definition The 5 steps of data preparation Data...
![[Podcast] The essence of Data Art and Data Visualisation](https://www.intotheminds.fr/blog/app/uploads/collage-closeup-240x240.jpg)
[Podcast] The essence of Data Art and Data Visualisation
Nicholas Rougeux defines himself as a “data artist”, and his talent for visualising data is obvious. So obvious that he markets his work in the form of posters and I even got one for my birthday 🙂 Run to his blog (www.c82.net) if you lack inspiration or if you want to see the best in DataViz. In this podcast, I talk with Nicholas about his creative process, his sources of inspiration, and of course, the technical aspects of...
Isometric Hexmap using Tableau: a step-by-step guide
As part of my participation in the Iron Viz 2020, I created a new type of visualisation using Tableau, which has received a lot of positive feedback. I called it ‘isometric hexmap’. In this article, I explain how to reproduce this type of representation and give you access to the source files. You can access the interactive version on Tableau Public. If you like this visualisation, feel free to leave a comment and to use it....

Tableau Iron Viz 2020: thoughts on my first participation
The Iron Viz is the “world championship” that crowns the 3 leading Tableau developers, a software that allows you to visualise the data. This year I decided to participate also (access my contribution here). In this article, I look back on my experience, what I learned from the preparation of the competition and the difficulties I encountered. 6 tips for a good #Dataviz Spend time choosing a rich, quality primary data source rather than making multiple joints. Enrich...
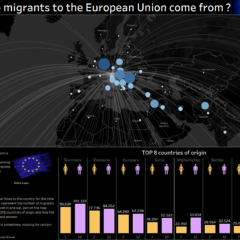
Migration to Europe: interactive visualisation using Tableau
How can migration to EU countries be represented attractively? This is the question I wanted to answer using Tableau Software. If the question was simple, the answer was not so simple, and it took me a few days of deliberation to find the right solution and the right design. Below I present it to you with the modus operandi to reproduce it. Only for our subscribers: exclusive analyses and marketing advice Email address * Subscribe By...

Fuzzy matching between tables: 2 ETL compared (Tableau Prep Builder vs Anatella)
If you are manipulating data for analysis or visualisation purposes, you may have encountered this problem before. You need to create a join between 2 databases, but the entries in the reference field are not the same. Differences in spelling, different terminologies, … the reasons are many and varied. During the research that I’m doing to visualise migration flows, I was confronted with this problem. I had to solve it by using an ETL (Extract – Transform...

![Data marketing: advantages, strategy, and examples [Guide 2023]](https://www.intotheminds.fr/blog/app/uploads/data-marketing-computer-60x60.jpg)


![LinkedIn: engagement statistics by country and language [2021]](https://www.intotheminds.fr/blog/app/uploads/likes-comments-share-60x60.jpg)


![How many hashtags should you put in your LinkedIn posts? [Research]](https://www.intotheminds.fr/blog/app/uploads/analysis-hashtags-linkedin-60x60.jpg)

