After analysing the best hours to post on LinkedIn, I tackled a much more difficult problem: determining which topics generated the most views and engagement on LinkedIn.
In today’s post, I will show you the results I was able to achieve using 2 specific tools: Anatella for data extraction and preparation on the one hand, and Tableau for exploring and visualising the effects on the other.
If you are interested in this type of analysis and wish to obtain a personalised study, please contact me by email or … via LinkedIn 🙂
If you only have 30 seconds
- I have developed a method that automatically analyses the topics you have been talking about on LinkedIn.
- The items you talk about most often on LinkedIn are not necessarily the ones that bring you the most likes and comments.
- The “subject” of a LinkedIn post would appear to be correlated to the number of comments and likes you receive.
- Niche topics may bring 100 to 200% more views than mainstream topics
- Niche topics may bring 50% more reactions than mainstream topics
Summary
- Introduction
- Methodology
- Evolution of LinkedIn topics per year
- Relationship between LinkedIn subject and the number of views
- Relationship between subject matter and the number of reactions
- Conclusion
- Acknowledgements
Introduction
What do you have to talk about on LinkedIn to get your network involved? This is the research question I asked myself in the framework of my research program at the LaDisco laboratory (Université Libre de Bruxelles).
First, I performed an NLP (Natural Language Processing) analysis of each of my +/- 4000 messages posted on the social network over the last 10 years. I then linked the topics covered in each post to the number of views, comments and likes I received.
This type of analysis allows me to answer several questions:
- how have your interests changed over time?
- what are the subjects that will bring in the most views?
- which topics have brought you the most likes and reviews?
Methodology
To extract the LinkedIn data, I used a method derived from the one I outlined in a previous post. Two sets of data were used:
- LinkedIn’s 10-year archive, which allows for a longitudinal analysis of the subjects treated
- A multitude of JSON files extracted from the LinkedIn pages that will enable a precise reconstruction of the number of views, comments, likes and other reactions on the last 1000 public messages.
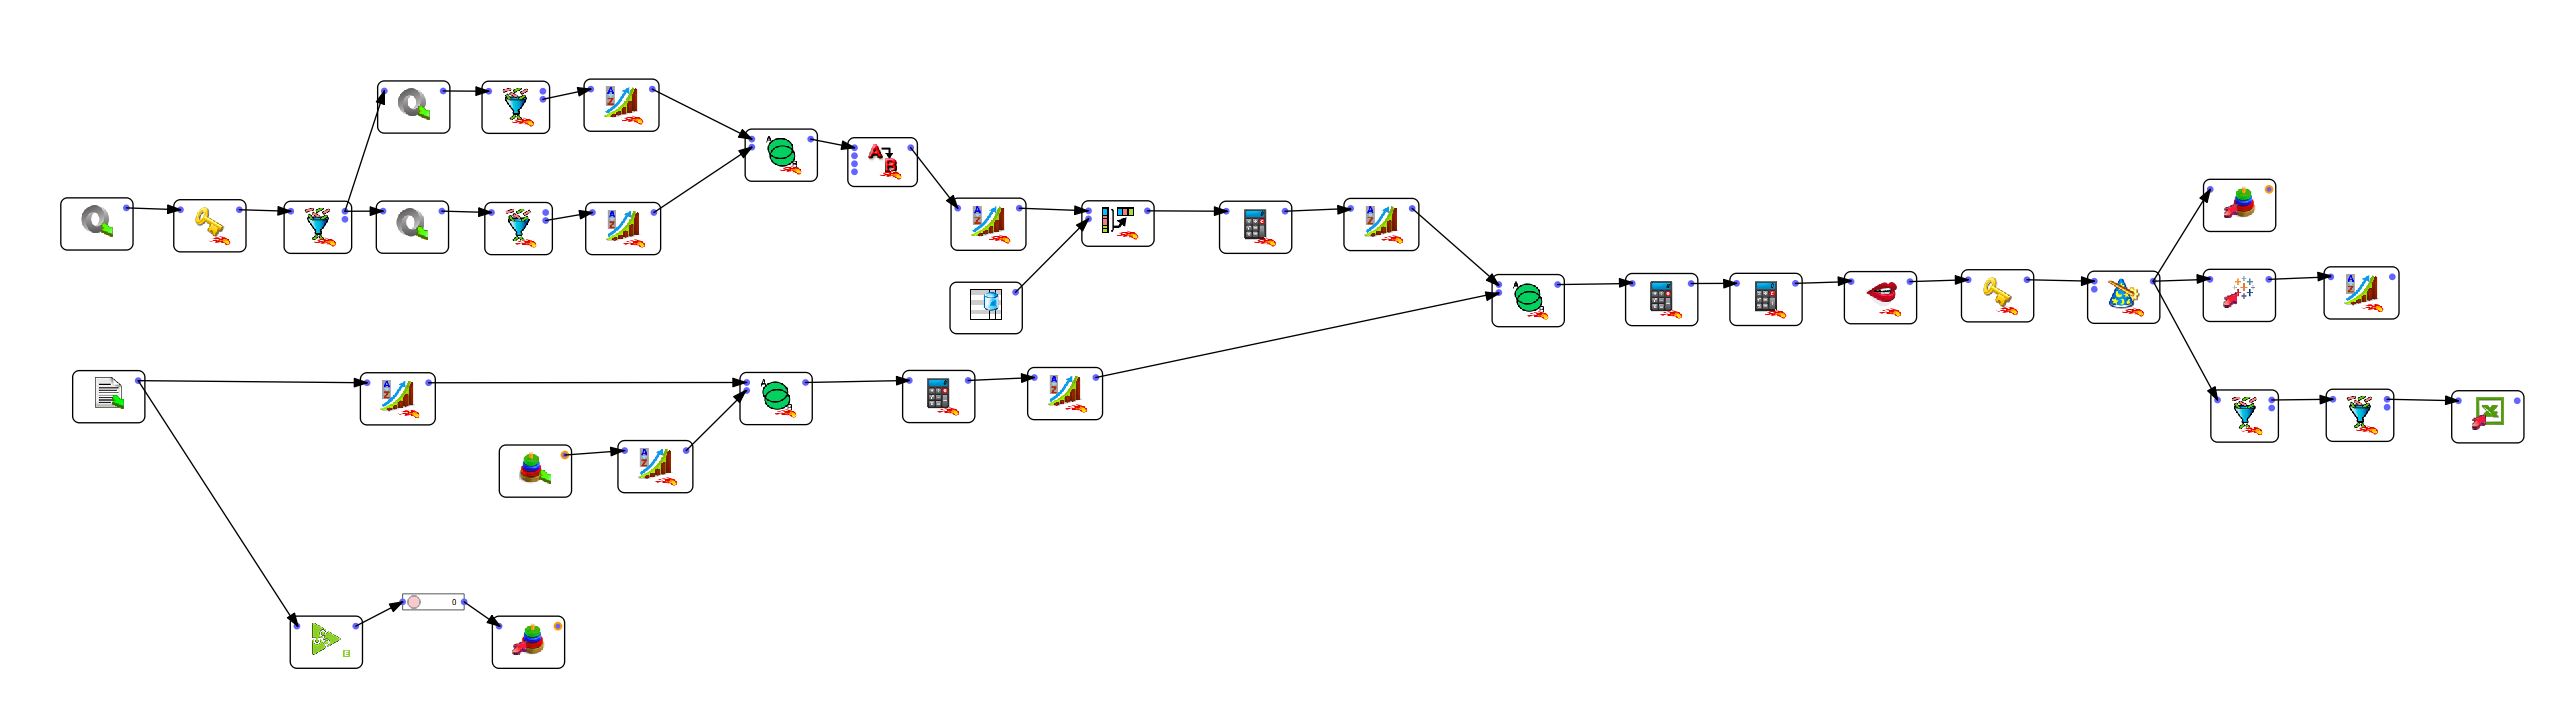
The content of each message was then analysed thanks to an NLP (Natural Language Processing) algorithm that allowed me to extract the themes treated. Several themes are assigned to each message, and a coefficient is appointed to represent the confidence of the algorithm in the identification of the subject. After a quick check, I decided to keep only the topics whose confidence coefficient was higher than 0.75. This eliminates the majority of false positives. I could have been even more restrictive, but there would be fewer correlations to analyse, and above all, I would have eliminated true positives.
Methodological note: the following exchange with Bruno Fridlansky, a French expert of the LinkedIn network, the latter asked me why I was not using the “reactions.csv” file present in the archive file. The reason is that the “reactions.csv” file is incomplete. The method developed based on the extraction of JSON files makes it possible to trace about 5000 reactions over 3 years. In contrast, the data provided by LinkedIn only counts 1500 over 10 years.
Now to the results.
Rather than talking about anything and everything on LinkedIn, why not indeed focus on what brings you the most views?
What have I been talking about on LinkedIn for the past few years?
The visualisation below shows you, year after year, the themes I have tackled on my LinkedIn profile (click on the image to expand).
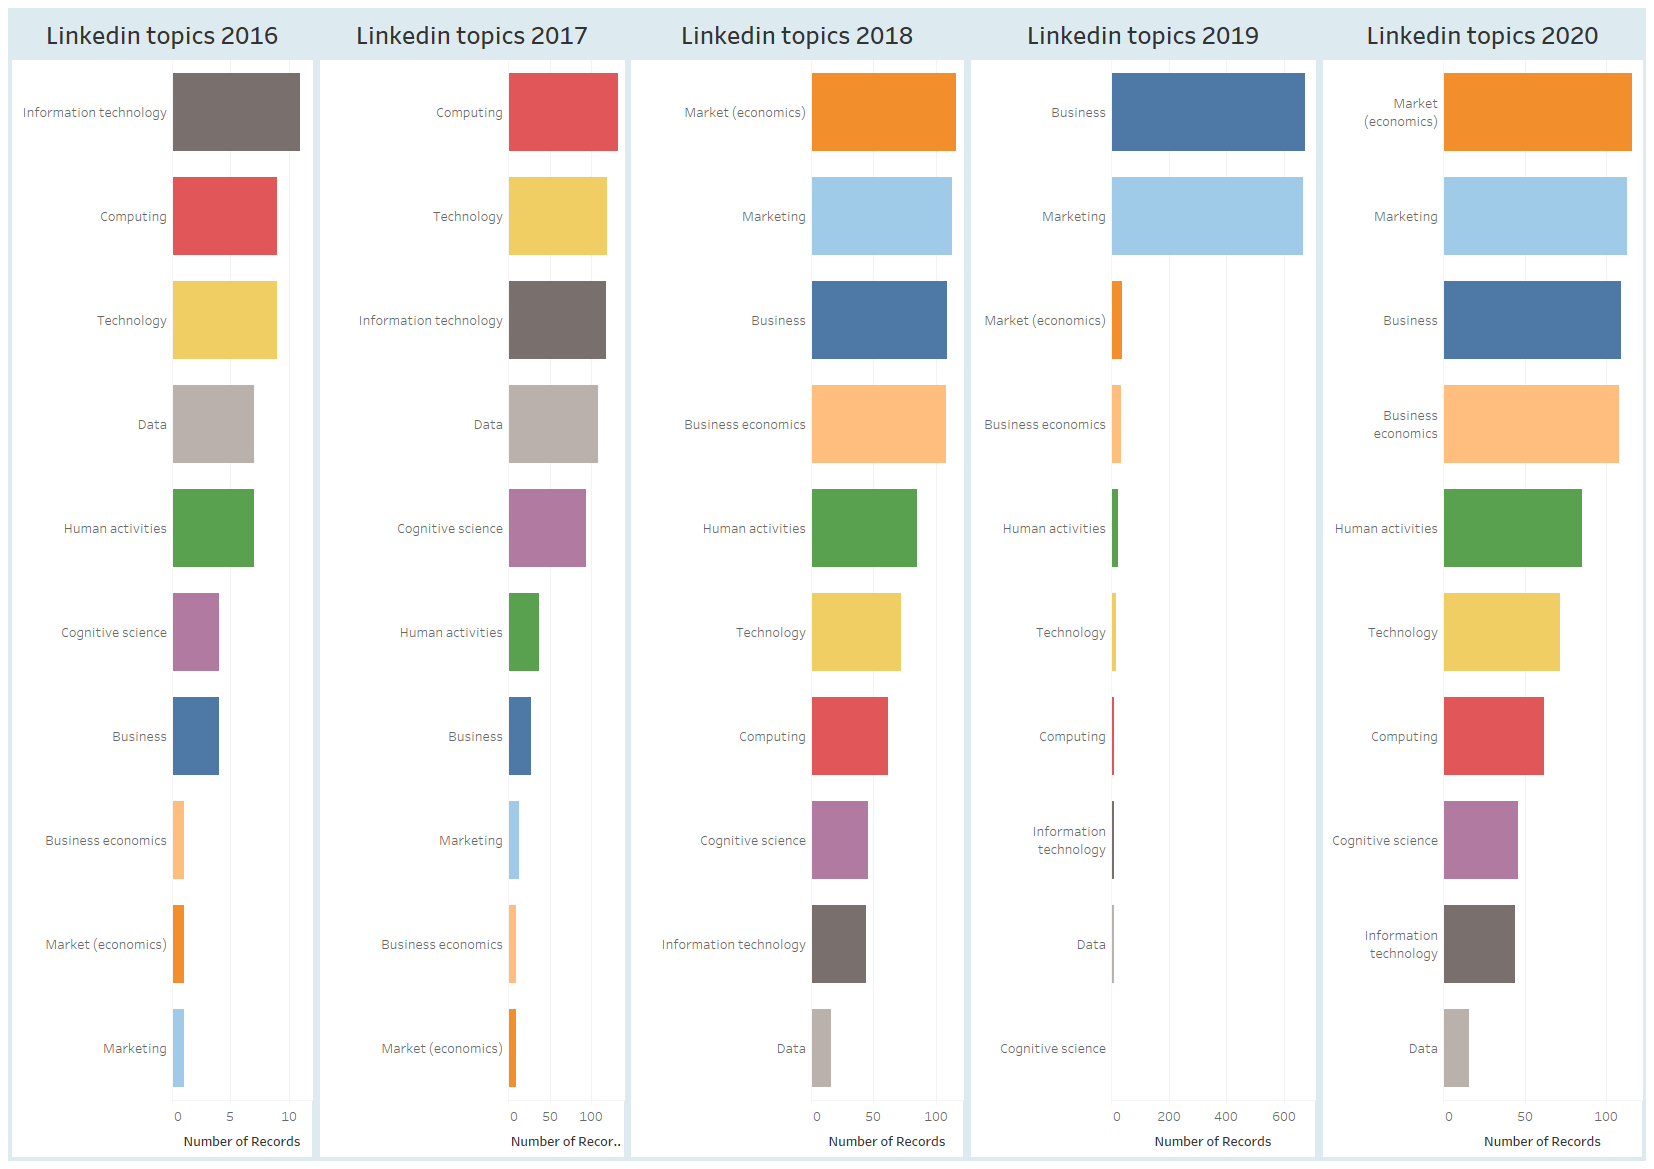
As you can see, my favourite subjects have not remained the same, and instead reflect the projects I was working on and the interests I developed.
I was astonished to see that in 2019 my publications were dominated by 2 subjects (business and marketing) and that the technological aspects that predominated in previous years faded away that year. The balance seems to have been restored in 2020.
Rather than talking about anything and everything on LinkedIn, why not indeed focus on what brings you the most views?
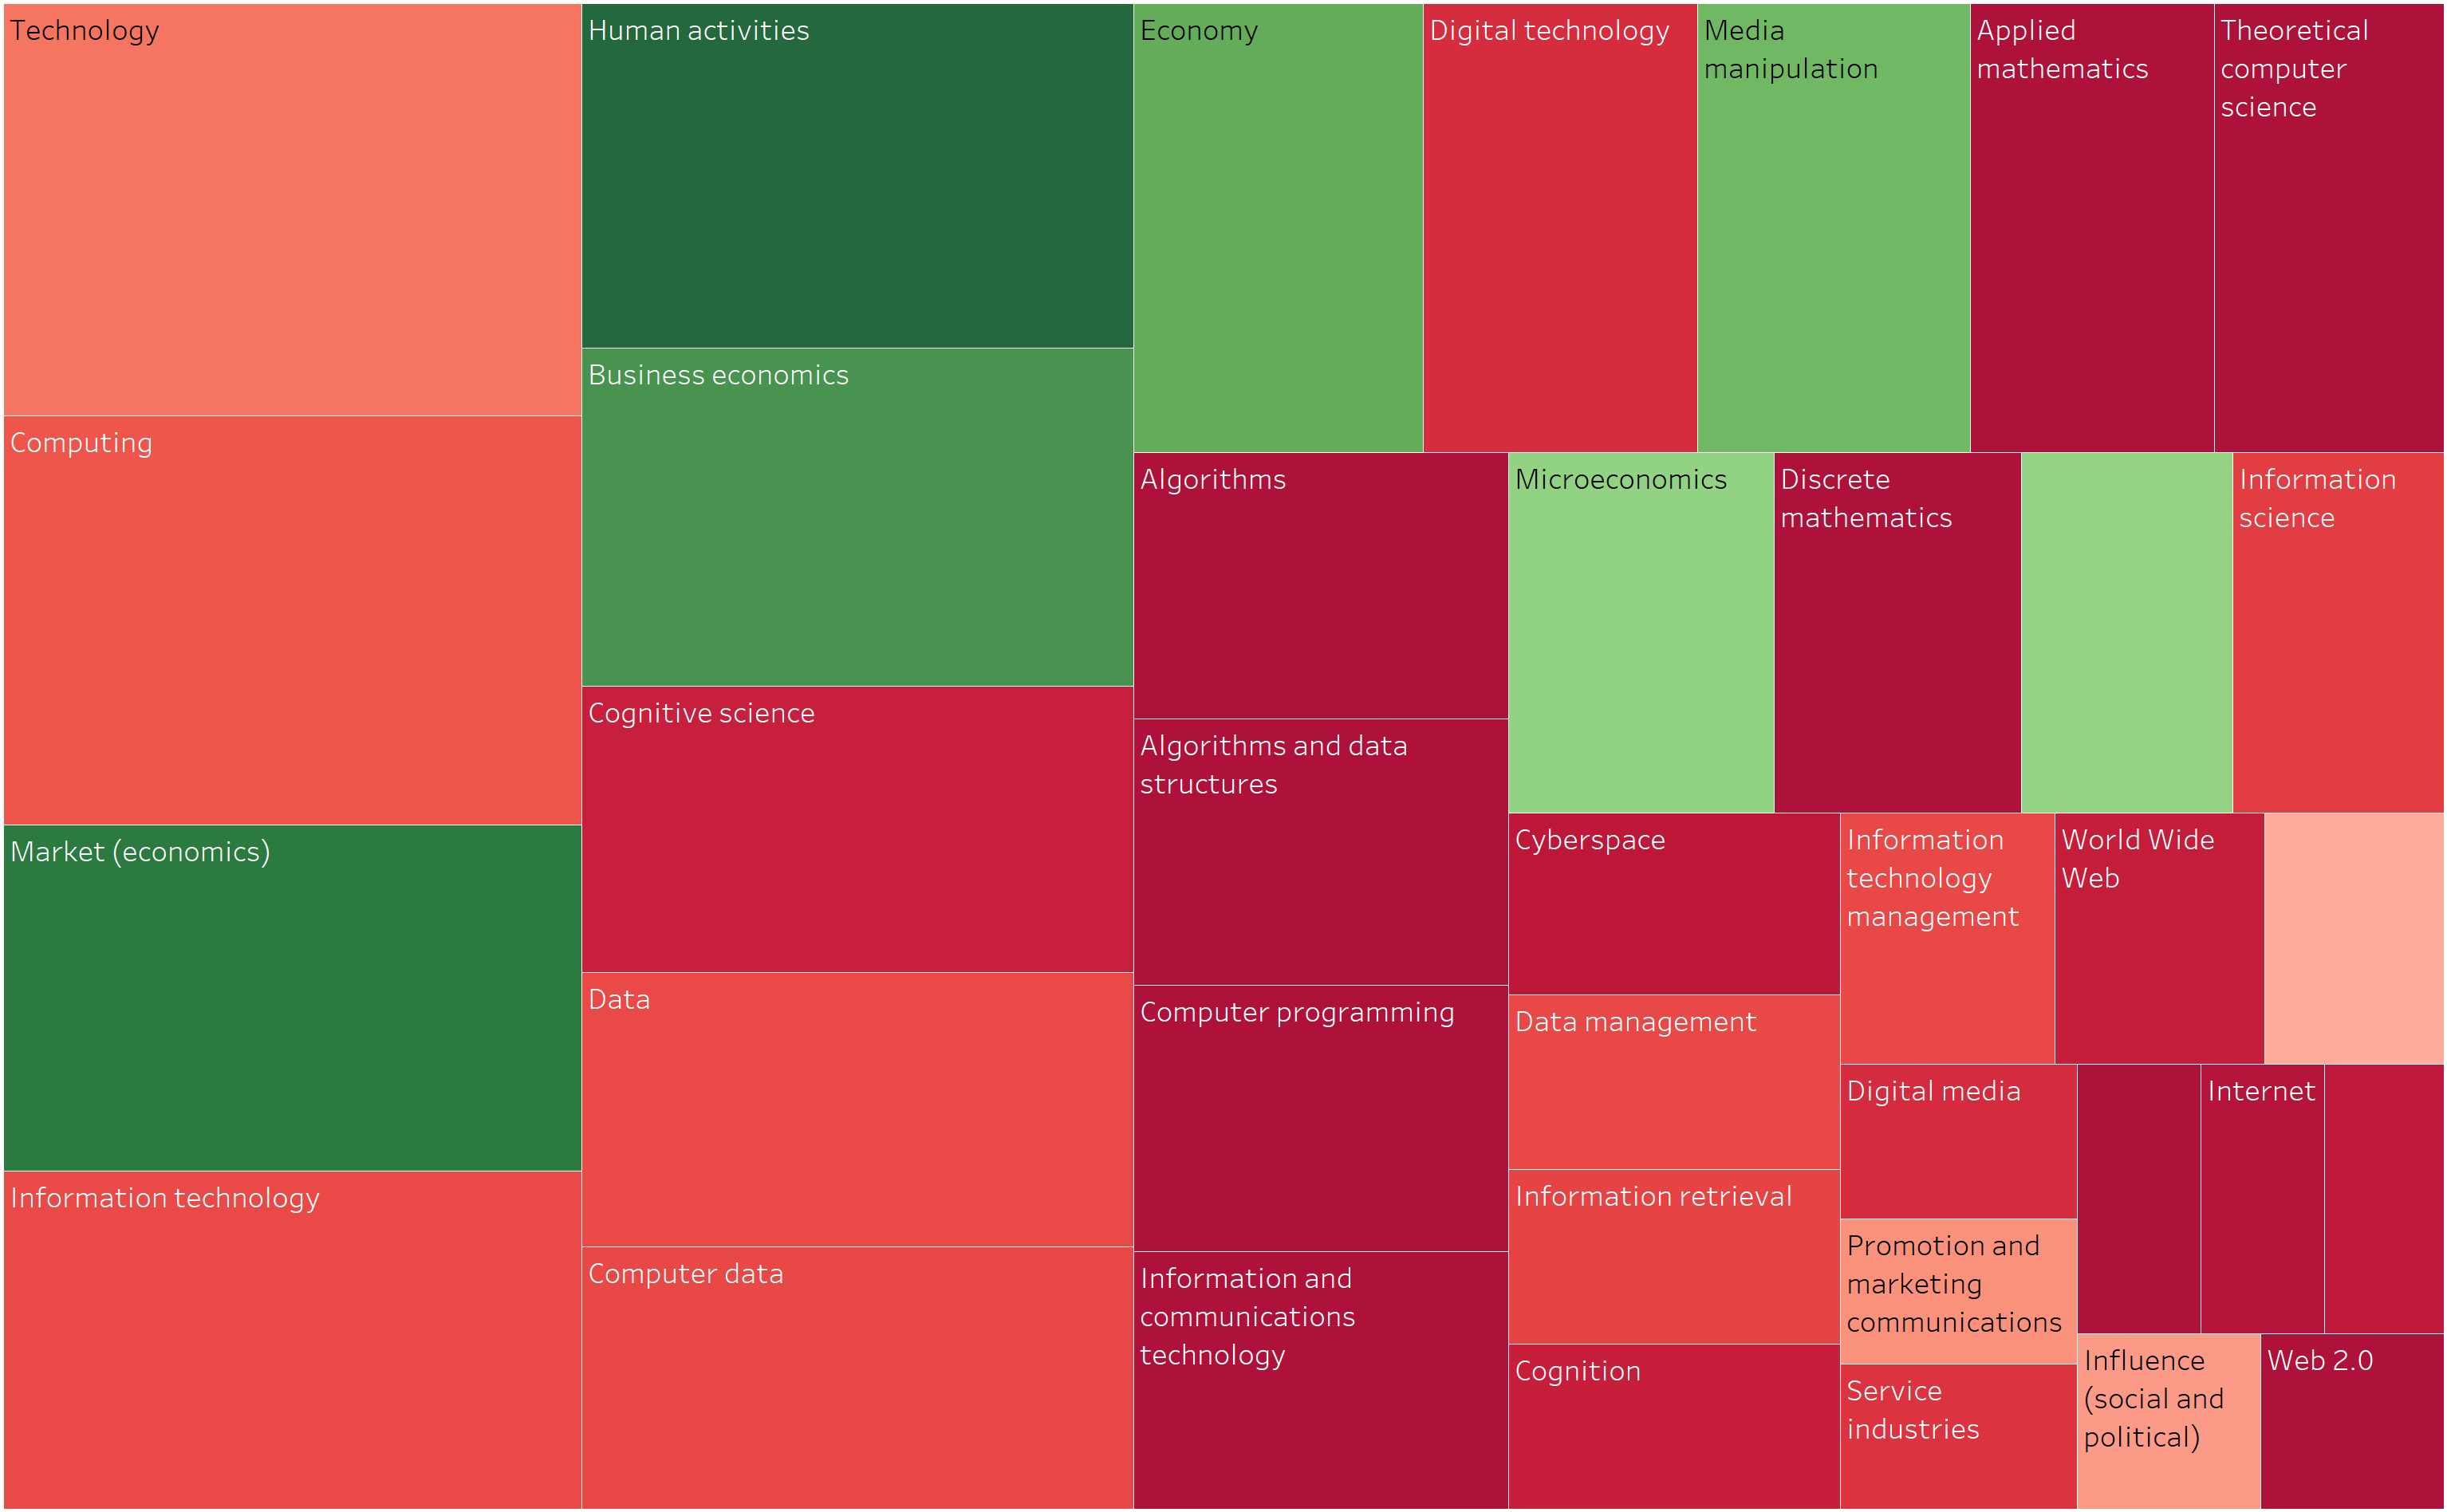
What subjects have brought me the most views on LinkedIn?
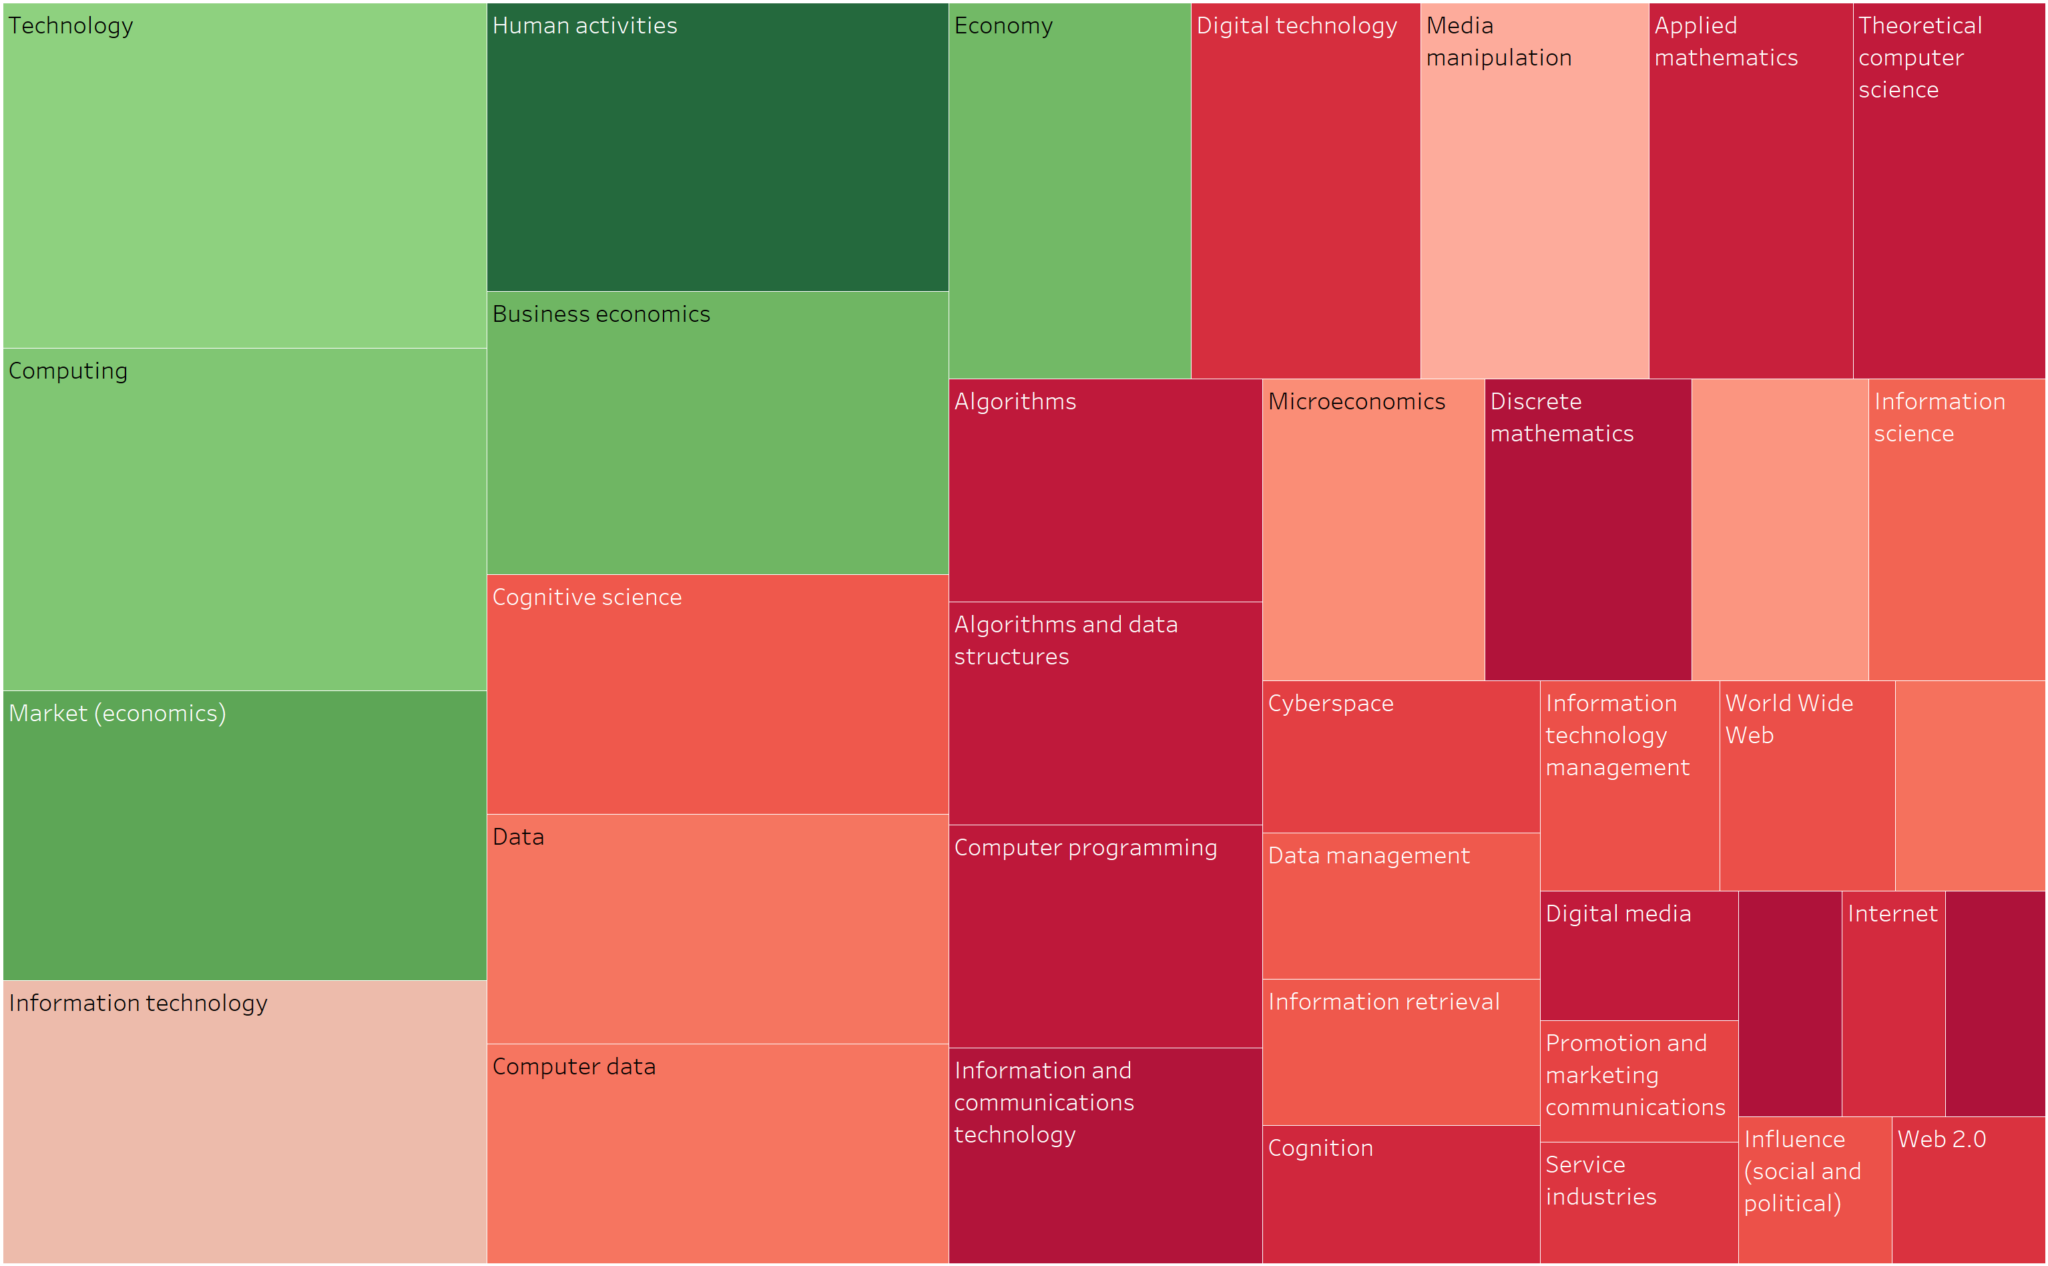
Here’s a question everyone should ask themselves. Not all subjects are necessarily suitable to be covered on LinkedIn. Your network may be sensitive to particular topics that you need to have identified. Rather than talking about anything and everything on LinkedIn, why not focus on what gets you the most views? That’s precisely what I’ve been trying to find out by representing the topics that have been covered over the years in the form of a “treemap” on the one hand and then adding a colour indicator to identify the most promising topics.
What topics have created the most engagement on LinkedIn?
Finally, the last question is the commitment of your network. Here again, this is a theme often addressed by LinkedIn experts: “you have to talk about this or that to get reactions from your network”.
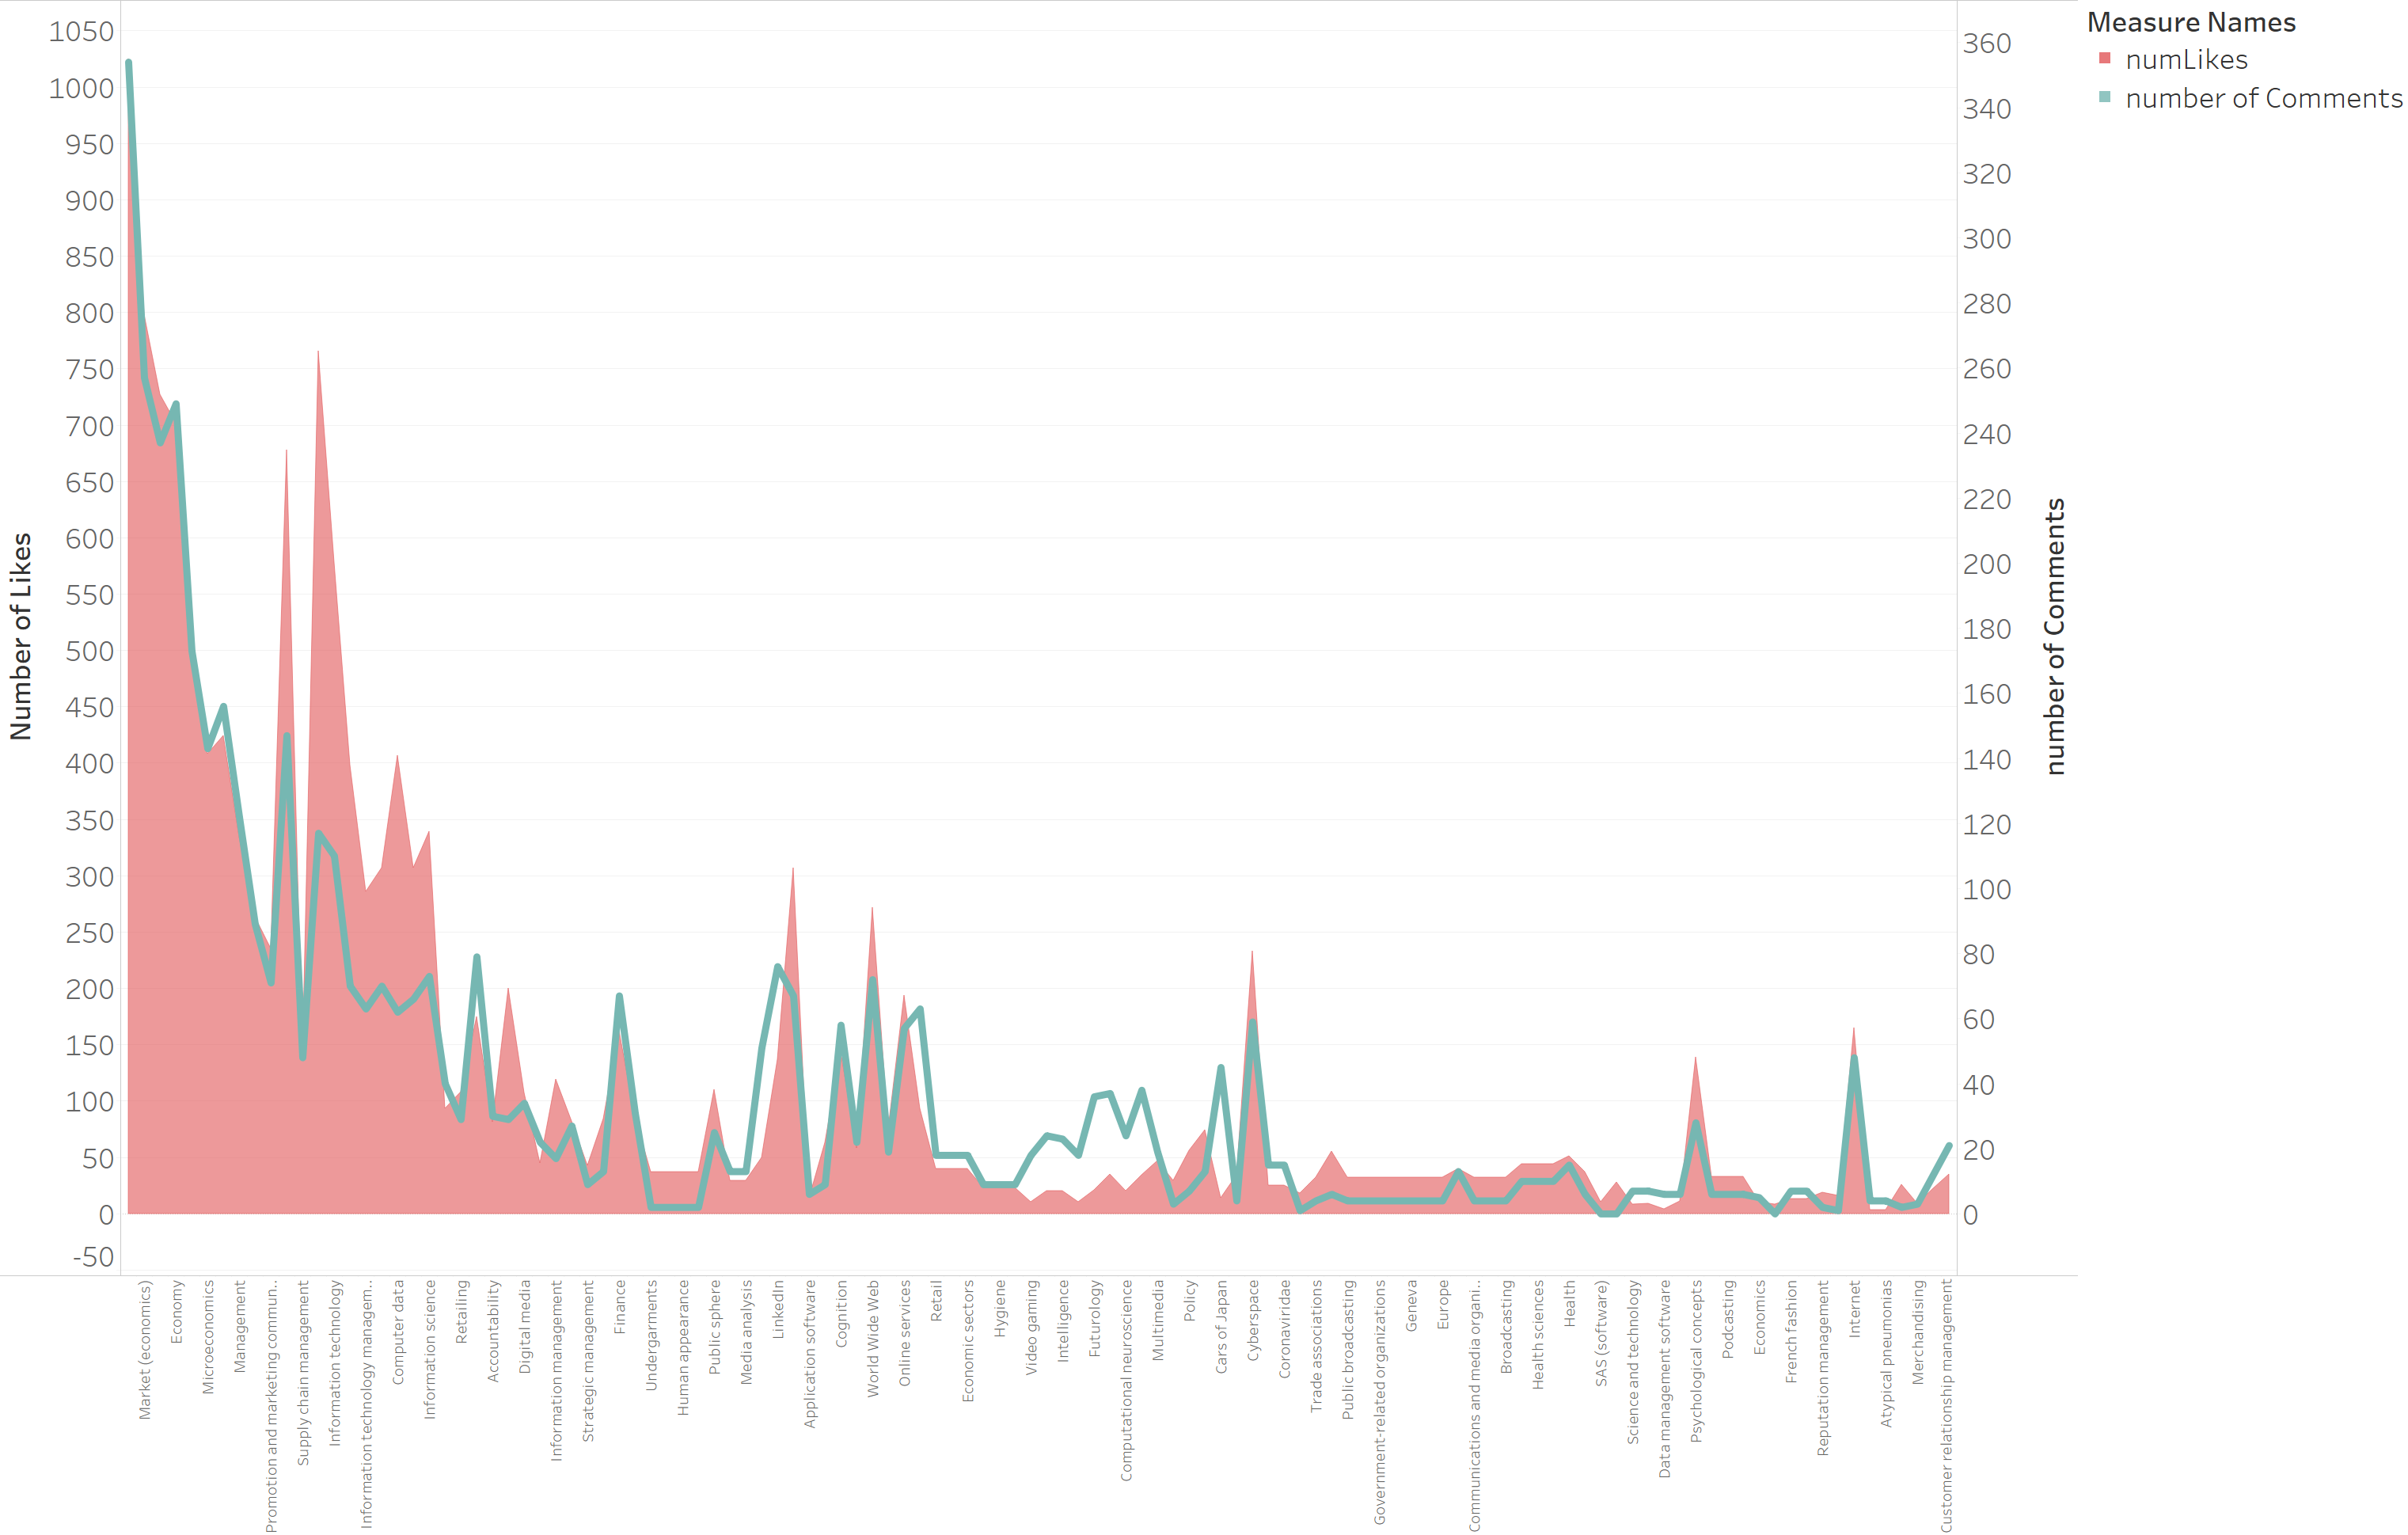
To get to the heart of the matter, I wanted to find out more. I’ve represented on the one hand the topics covered in the form of a histogram, and on the other hand, the number of comments and likes received.
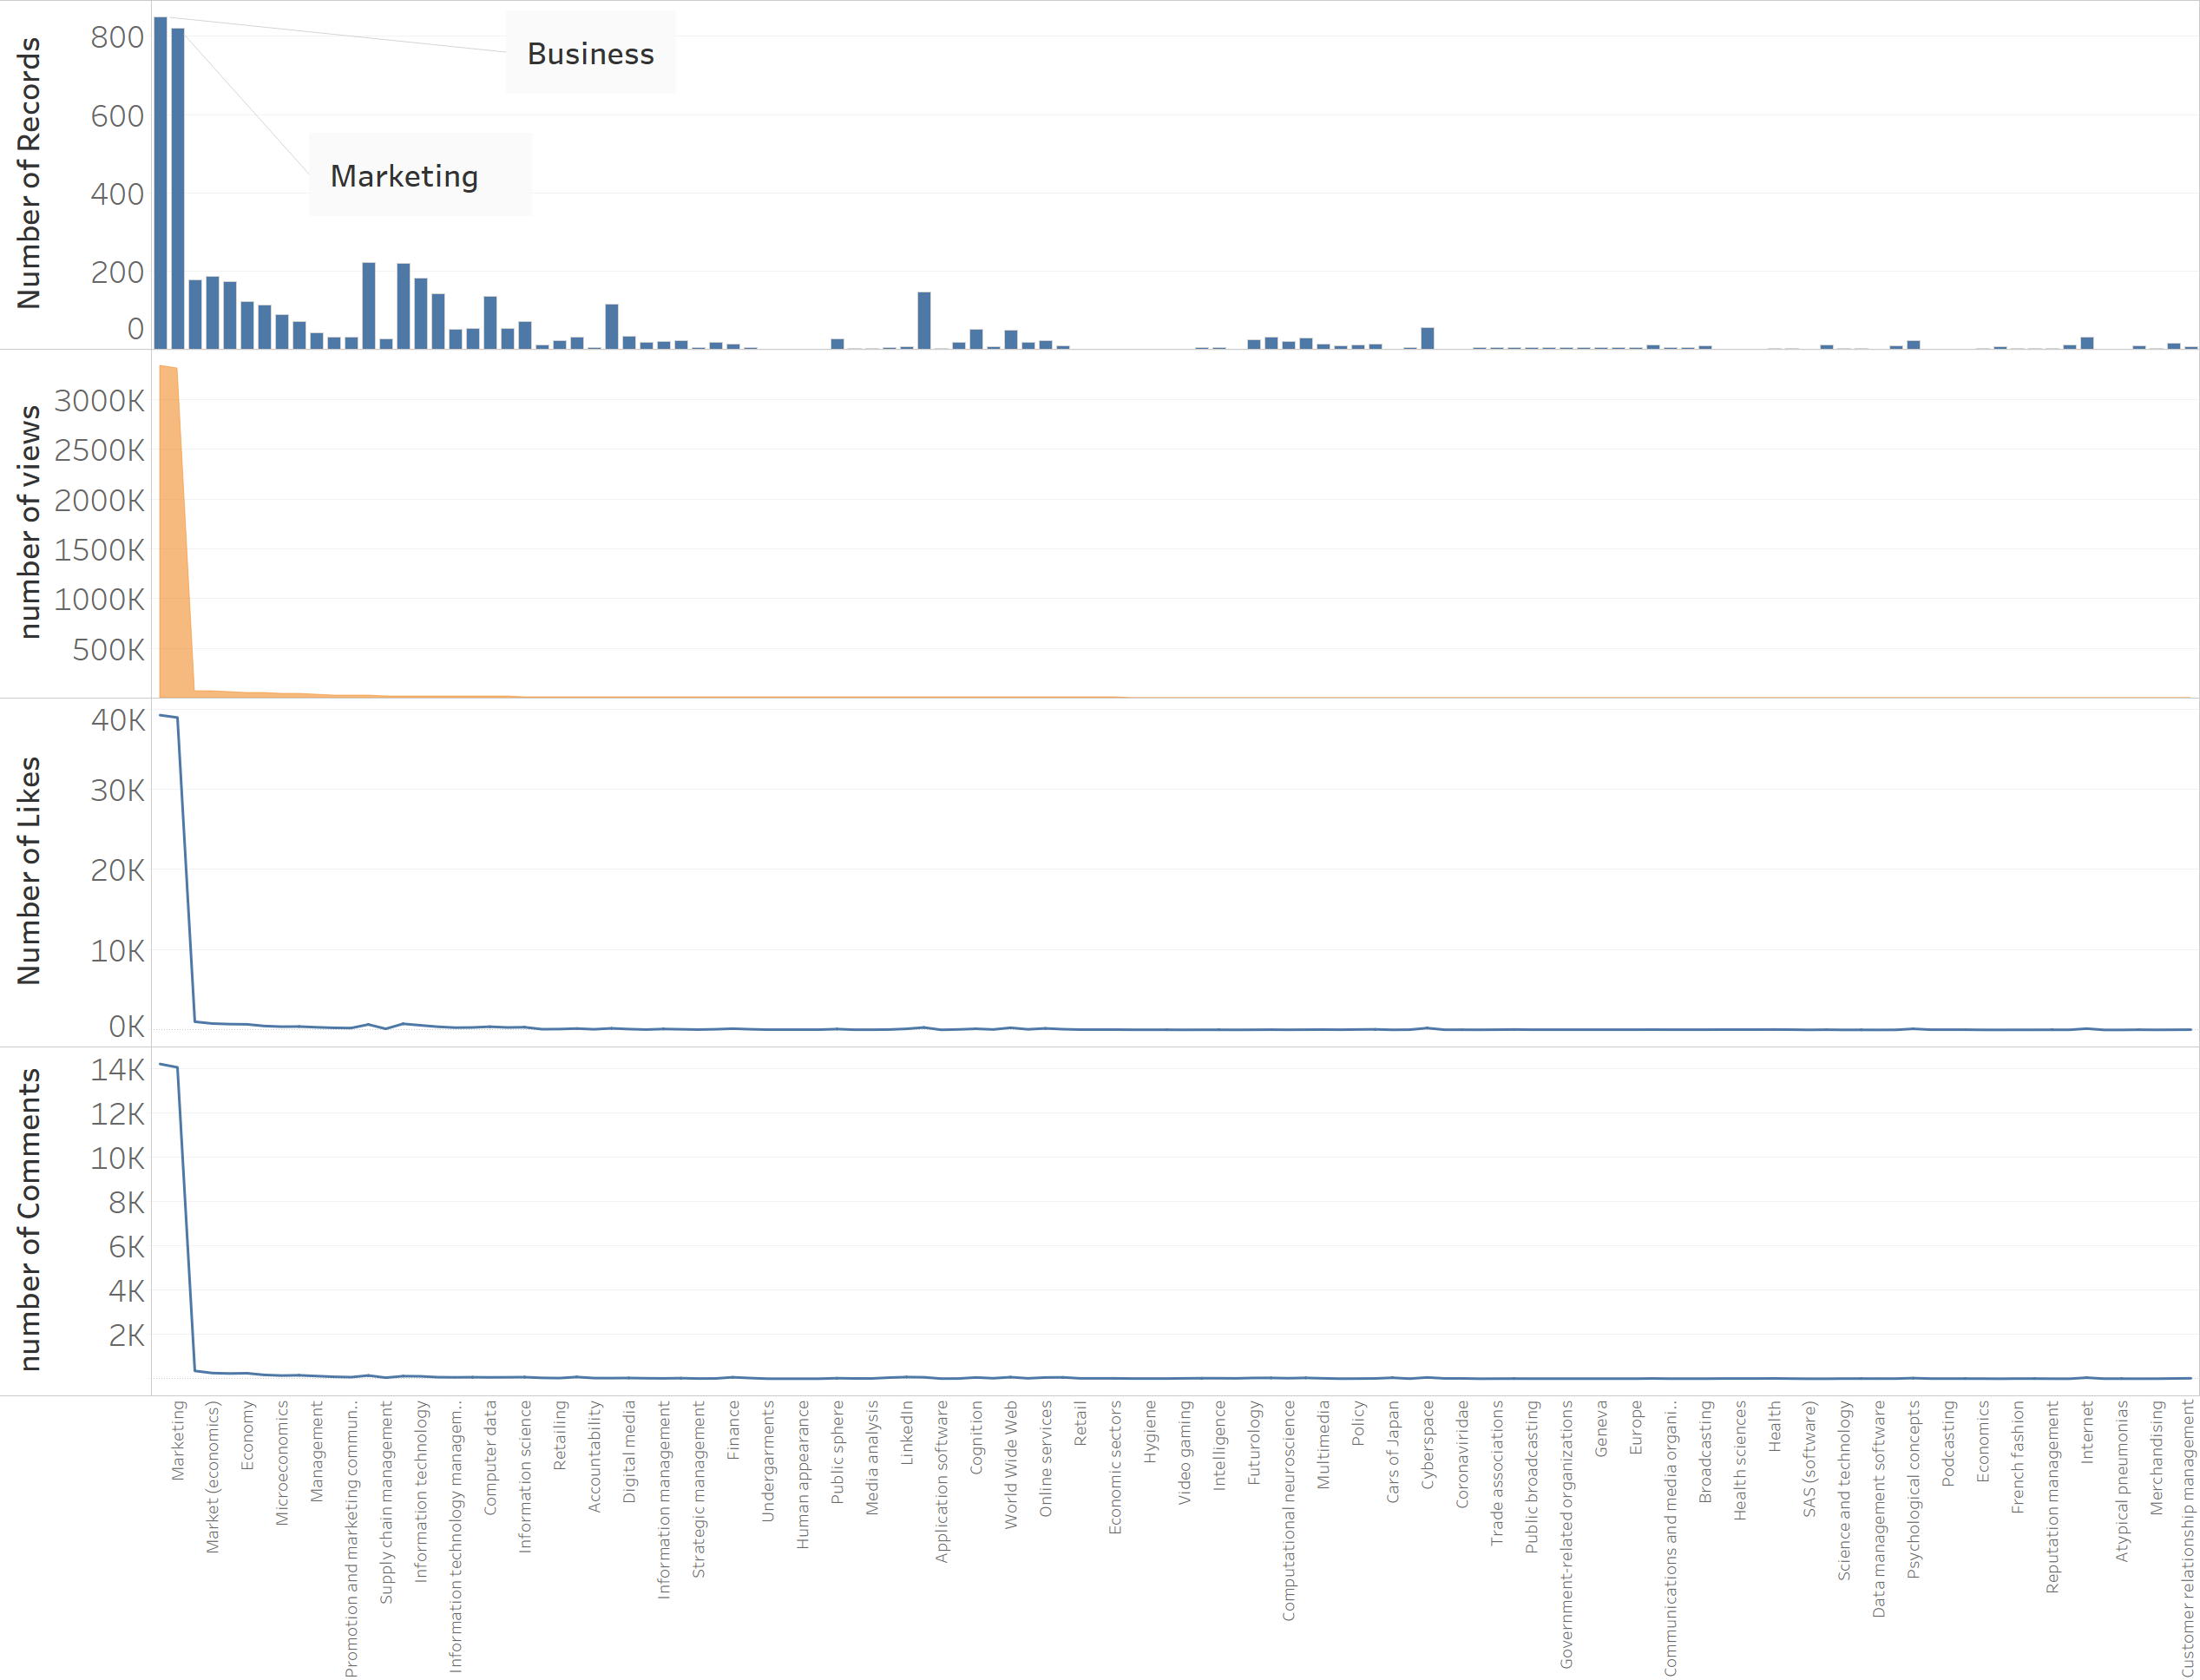 As you can see, the “business” and “marketing” themes are the ones that concentrate the most reactions. To get a clearer picture, I have therefore temporarily excluded these topics from the analysis to prevent them from “overwhelming” the others.

You will first notice that the curve of “likes” and “comments” follow each other quite well when you analyse them according to the subject matter (see graph below). There is, therefore, a relationship between the number of likes and the number of comments received on a LinkedIn post.
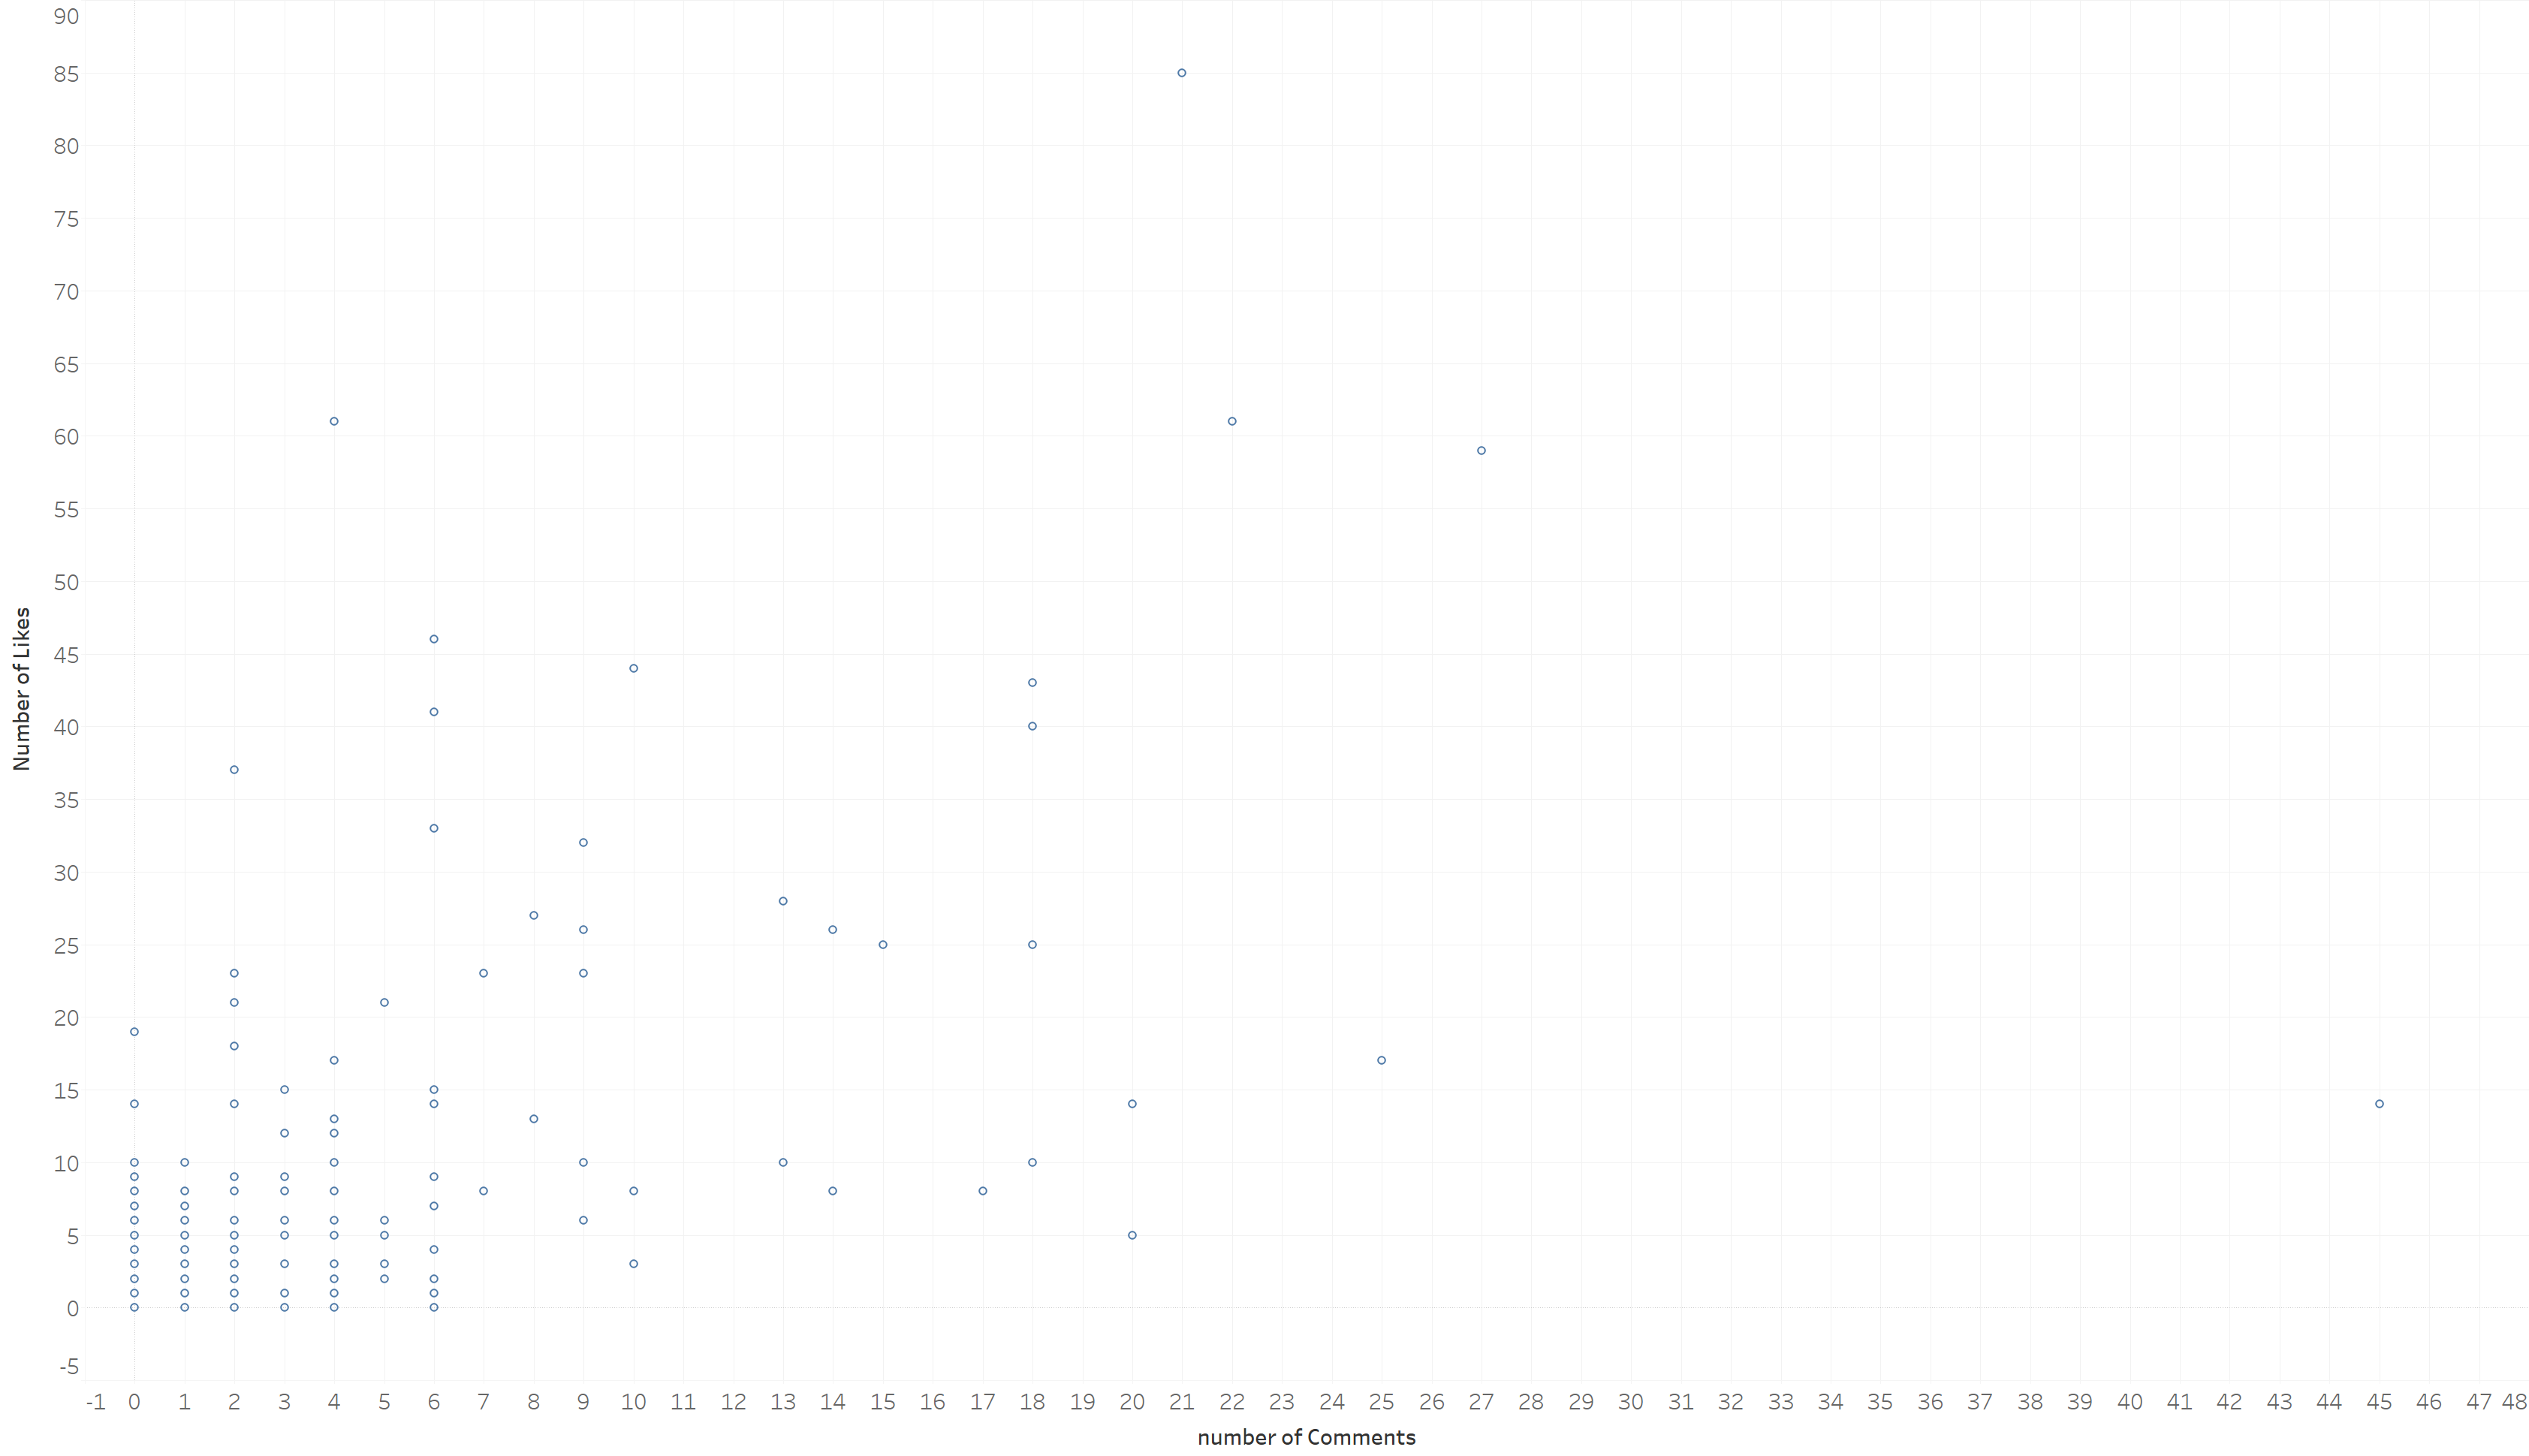
On the other hand, this relationship is not as apparent with a traditional scatter plot (see below). We can, therefore, suspect that the “subject of the LinkedIn post” is a moderator variable.
To make the results even more transparent, I reused the “treemap” and added colour to identify the number of reactions (likes + comments) received. As you can see, the topics I dealt with most often are not necessarily the ones that provoked the most commitment.
Conclusions
This preliminary study allows to validate a methodology 1) to extract themes from public messages posted on LinkedIn, and 2) to link these themes to the number of views, comments and likes.
The data extracted in this way makes it possible to visualise the evolution of a person’s centres of interest over time and to identify the most promising subjects.
This work is only a preliminary step in a more global approach to understanding the dynamics of the LinkedIn network. Control variables such as the size of the network and the time of publication are not taken into account here.
Acknowledgements
At the end of this first chapter of my work, I would like to thank Frank Vanden Berghen, Raphaël Vander Marcken and Michael Silvestre for their valuable assistance in carrying out this analysis.
Thanks also to Frank and Raphael for their adaptations of Anatella for this research.
Posted in big data.